This month’s case study from Pico Technology details Ives Garage’s diagnosis of a Honda Civic experiencing abnormal levels of vibration whilst accelerating.
NVH diagnostics requires a methodical approach and evaluation of test results to reach a conclusion that is satisfactory for all parties involved. The case study below describes the rapid identification of a customer’s complaint of vibration and how using multiple sensors (either microphones or accelerometers) become invaluable in locating the source of the problem.
Customer’s description
The customer reported that a severe vibration was present throughout the vehicle while accelerating from 45 to 55 mph. (N.B. In this case, the customer was a trade person concerned about a vibration after an engine repair.)
Technical description
Verifying the customer complaint is an essential step in the diagnostic process. However, it can quite often be a time-consuming task without much success. The initial road test did not reveal any major concerns for a vehicle of this age and mileage. However, after driving about 8 miles, we detected a severe vibration under acceleration only. When we accelerated, we felt a severe vibration. When we decelerated, the vibration cleared immediately. The vibration occurred around 45 mph, where items in the cabin (e.g., keys and coins etc.) would tremor in unison.
While we could describe the vibration as making the vehicle “borderline undrivable”, there were occasions where no vibration was present at 45 mph under acceleration, even after prolonged driving. (The vibration was intermittent.)
Diagnosis
With the customer’s complaint verified, we confirmed the Vehicle’s ID and Specification.
Confirmation of specification is of the utmost importance when it comes to diagnosis. Customers are often tempted to modify their vehicle with fashionable accessories that lack the fundamental quality control and engineering that was intended for the vehicle.
We noted that the vehicle had been fitted with three “budget” tyres, where two appeared to have covered very few miles indeed.
The customer interview follows the 4 targeted open-question principle below to help us establish facts from fiction:
- How long has the problem been evident?
There was no previous experience of a vibration, even though the vehicle was originally scheduled for an engine running problem that developed into an engine failure (read more about this vehicle here). - When did you first notice the problem?
There were no reports of vehicle vibration (it was only discovered after the engine repair). - Has any work been carried out on the vehicle recently?
Yes, major engine overhaul due to timing chain wear. - When do you experience the problem?
Every drive after approximately 8 miles, when accelerating between 45 and 55 mph.
Quite often the customer interview leads to a probable diagnosis, and given the history of the major engine overhaul, it is difficult not to jump to conclusions. Especially since the vibration is only present under acceleration.
The basic inspection confirmed no fluid leakages, no visible signs of damage to hoses, connections, or wiring harnesses, or indeed that favourite discovery, accident repair.
A vehicle scan of all onboard control units revealed no fault codes, which suggests that our symptom is outside the detection condition of the engine ECU.
Possible causes
- Engine misfire under acceleration
- Incorrect installation of engine mounts or ancillaries
- Worn or out-of-balance driveline components
- Worn suspension components
- Wheel and tyre runout or imbalance
The action plan
The action plan was predominately governed by accessibility, probability and cost. Based on the symptom, we required objective measurement data to establish not only the level of vibration (amplitude) but also the offending frequency as well as the axis of the vibration.
What better tool for such a task than the Pico NVH kit?
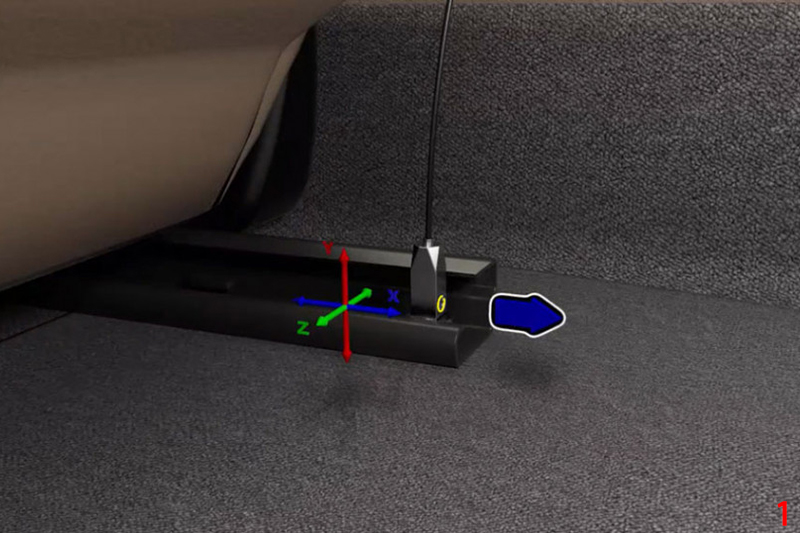
We started with a 3-axis accelerometer mounted on the driver’s seat mounting boltvand a microphone mounted inside the cabin. We now have all avenues covered. (Fig.1/main image)
The accelerometer identifies the level of cabin vibration along with the offending frequency and axis. A word to the wise, however. To identify the offending axis of vibration, you must make sure that the accelerometer is mounted in the correct orientation as seen in the image above.
Since the complaint is vibration only (0- 20 Hz), the microphone was only used to record any narrations from the driver such as location, road surface texture, vehicle posture, gas pedal position and steering angle to name just a few snippets of useful information during playback.
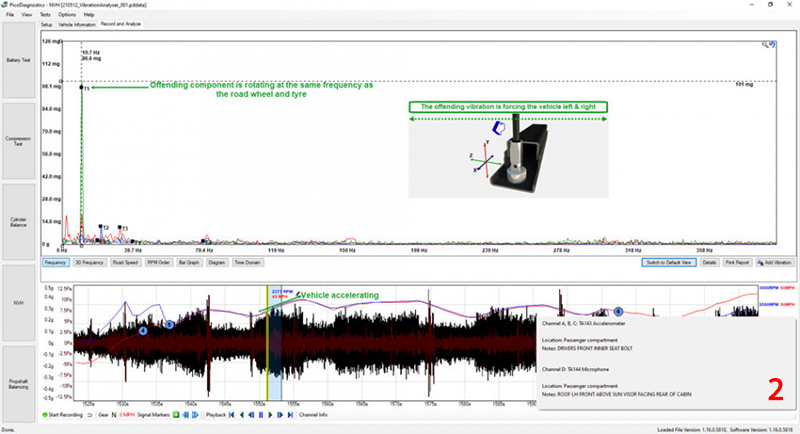
In Fig.2, we have the first capture from our initial road test. We identified an intense vibration of 101 mg at 10.7 Hz in the Z-axis (a lateral vibration) under acceleration. Our engine speed was recorded as 2377 rpm at a road speed of 45 mph. The vibration also occurs at the same frequency as “T1”. In other words, a component rotating at the same frequency as the road wheel and tyre.
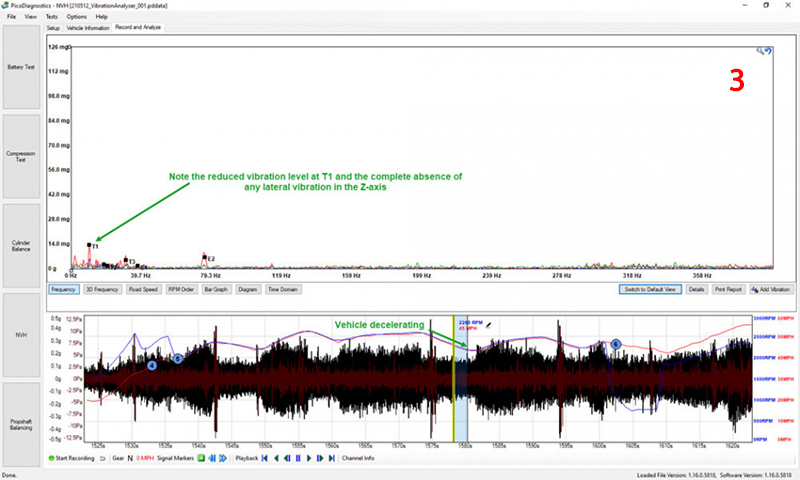
Note the level of vibration in Fig.3 when the vehicle is decelerating at the same road speed (45 mph). Our lateral T1 vibration has virtually disappeared!
So, now we have our objective measurement data, and offending frequency and axis. What do we do next? This is where multiple accelerometers come into their own and can assist with the diagnosis and zoning of a vibration.
Since our vibration is lateral (Z-axis), we now disconnect PicoScope channels A and B from X and Y on the NVH interface, leaving only Channel C to capture the lateral vibrations (the Z-axis) from the connected accelerometer.
The following tests were conducted with three accelerometers (measuring the Z-axis only) and a microphone mounted inside the cabin.
Channel A on PicoScope was connected to Channel Z on the NVH interface, which was capturing the lateral vibrations at the mounting bolt for the driver’s seat.
Channel B was connected to Channel Z on the NVH interface, which was capturing the lateral vibrations at the left-hand rear subframe.
Channel C was connected to Channel Z on the NVH interface, which was capturing the lateral vibrations at the right-hand rear subframe.
Channel D was connected to an NVH interface where any channel can be used, with a microphone connected and mounted inside the cabin.
It is advisable to keep an accelerometer mounted inside the cabin for all subsequent measurements. This will serve as a reference in which to compare vibration levels at strategic points about the vehicle.
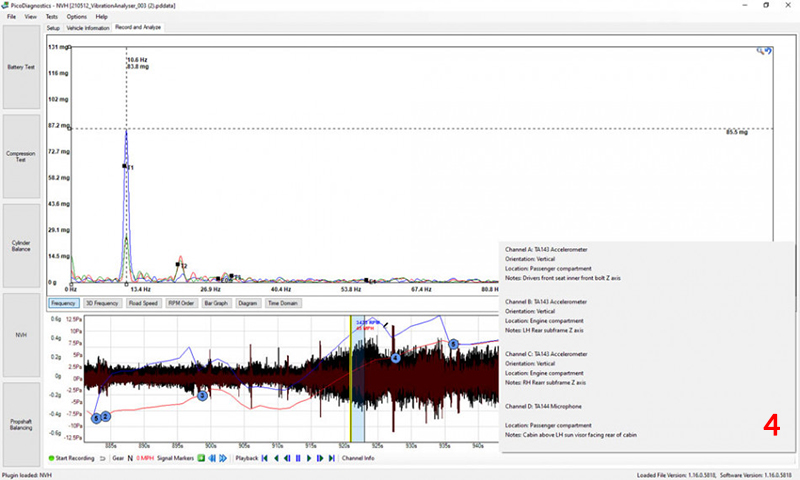
In Fig.4 we compare the lateral vibration levels at the rear subframe to the cabin.
We concluded that the lateral vibration inside the cabin was greater than the level at the rear subframe. Therefore, our additional accelerometers (Channels B and C) would be better positioned at the front of the vehicle.
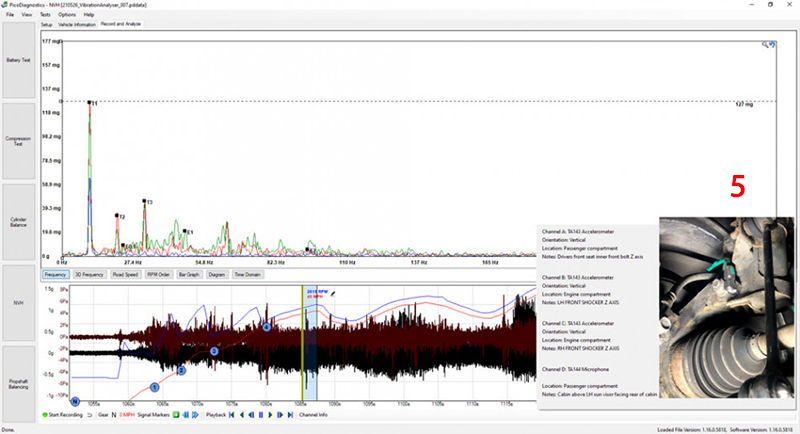
In Fig.5, accelerometers B and C were moved to the front shock absorbers, alongside the hub assemblies.
We had a clear increase in lateral vibration at the front shock absorbers, compared to the cabin. What I found bizarre about this severe vibration was that I could feel very little via the steering wheel. It all appeared to shake the cabin and floor pan (the chassis was the responder and not the steering).
Further road tests would periodically see a dramatic increase in the lateral vibration levels at both front shock absorbers. It was near impossible to qualify which side of the vehicle was the true offender. Where was the source of the vibration?
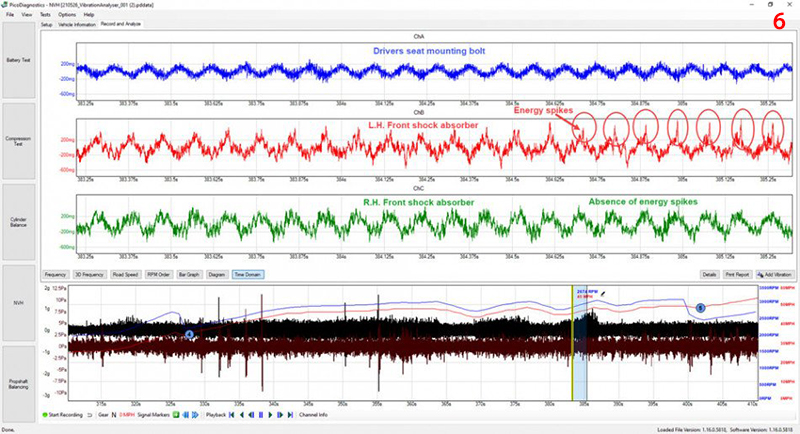
By using the Time Domain view in our PicoDiagnostics NVH software, we got a clue in the form of energy spikes. Fig.6 highlights momentary lateral energy spikes present at the left-hand front shock absorber only.
Based on the analysis in Fig.6, we needed to return to our list of possible causes and eliminate accordingly.
- Engine misfire under acceleration
I believed we could move away from a misfire, based on our T1, T2 and T3 offending frequencies, since a misfire would return an E0.5 vibration order. The engine management system would also record such an intense and prolonged misfire if applicable - Incorrect fitment of engine mounts or ancillaries
Any anomalies here are highly unlikely to appear as a T1 vibration order. A visual inspection confirmed that all ancillary and mount installations were correct and secure - Worn or out of balance driveline components
This was certainly a possible cause and required further investigation. A visual inspection revealed no concerns - Worn suspension components
A visual inspection confirmed that the suspension components were secure and with acceptable wear only - Wheel and tyre runout or imbalance
While this could be a possible cause of a T1, T2 or T3 vibration, wheel and tyre are unlikely to produce intermittent lateral vibrations under acceleration only
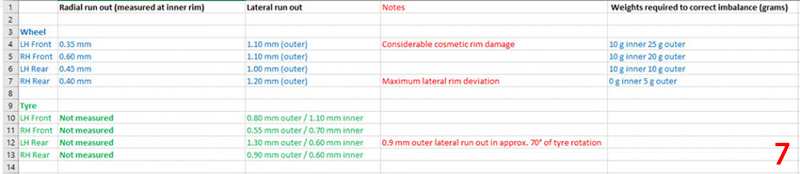
A severe lateral tyre vibration (at the front of the vehicle) would also manifest itself in the steering wheel, which was not evident at 45 to 55 mph. With that said, we used best practice to measure runout and balance and the results are recorded in Fig.7.
As you can see, we have what I can only describe as a pick and mix array of radial/lateral runout values accompanied by an assortment of tyres and rim damage. While these results require further attention, we balanced the wheels to 0 g and remounted them to the vehicle in their original orientation. Following the above, a brief road test confirmed that we had not achieved any improvements.
Given the intense level of vibration and the adverse effect it has on the cabin/chassis at 45 mph, it occurred to me that we could reveal the offending component by mounting a webcam under the vehicle.
By using the split-screen feature in Windows and the integrated Camera app of Windows 10, we were able to simultaneously monitor NVH data while capturing a response from numerous components within view of the web camera.

To watch the video, scan the QR code above. We’ll meet you back here next month to finish off!