
In the previous instalment of our guide to Bosch’s KTS diagnostics software, ESI[tronic] 2.0, we looked at RMI manuals, in this instalment we look at the benefits available when evaluating the ‘actual values’ of a system. An essential source of information for automotive system diagnosis and analysis, ‘actual values’ (AVs) are the variable data parameters that have been processed by the ECU.
Actual Values offer a useful representation of the state of an ECU system based on data collected from the sensors or switch input signals and the component outputs on the vehicle. You can use Bosch ESI[tronic] 2.0 to display the information in a variety of formats while also saving the results for benchmarking and comparison.
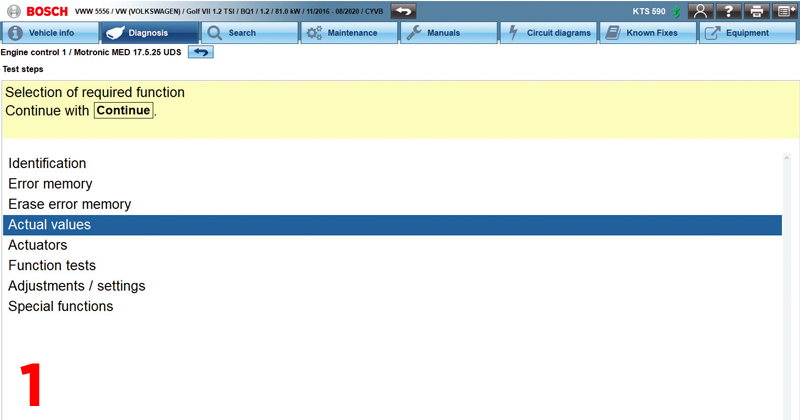
Once you have connected the Bosch KTS to the vehicle and selected the relevant system, ESI[tronic] 2.0 will offer you ‘actual values’ in the function selection screen if the ECU in question supports this type of data transfer (Fig.1). Remember, an AV can either be a numerical value of measurement, such as ‘control module supply voltage: 12.9 volts’, or alternatively an input or output condition like ‘drivers door status: door open’. The system continually refreshes the on-screen data stream to make viewing any changes in condition that are recognised by the ECU and visible in ESI[tronic] 2.0 simple.
Finding the right AV faster
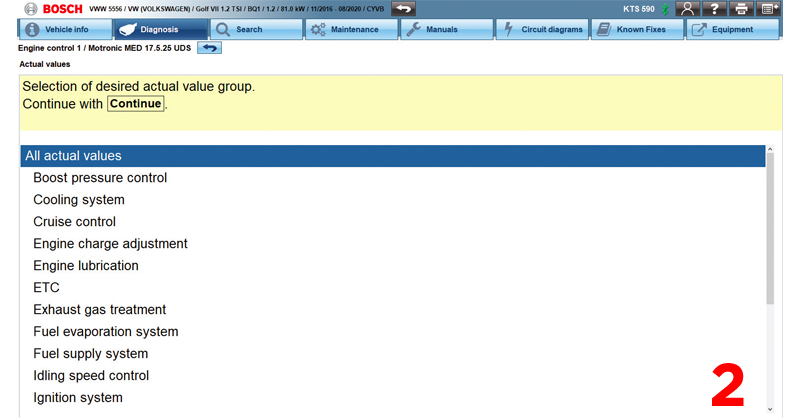
Modern vehicles’ ECUs can support hundreds of AV parameters. ESI[tronic] 2.0 simplifies the process of selecting the right AV by providing an ‘actual value group’ selection screen in some cases, and notably these ‘actual value groups’ help you to find exactly what you need, faster (Fig.2).
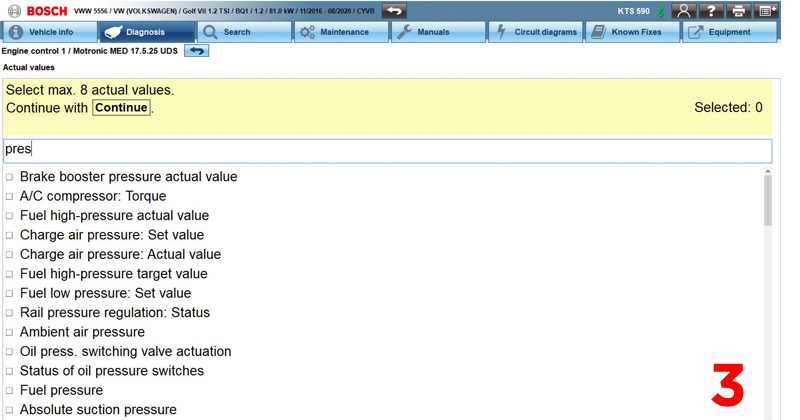
The ‘actual value’ search bar is another quick and easy way to efficiently search the list of AVs by key word. Simply type straight into the search field to filter the AV list to only show values that contain the text you have entered instantly (Fig.3).
Following your search, you can choose any of the required AVs to be displayed for comparison purposes. Up to eight different AVs can be displayed together and a ‘tick’ symbol in the box on the left confirms your selected values.
If you are using a computer with a keyboard, a handy tip for selecting values from the list is to use the up and down cursor keys to scroll through the list and the space bar or left/right cursor keys to select or deselect the highlighted value name.
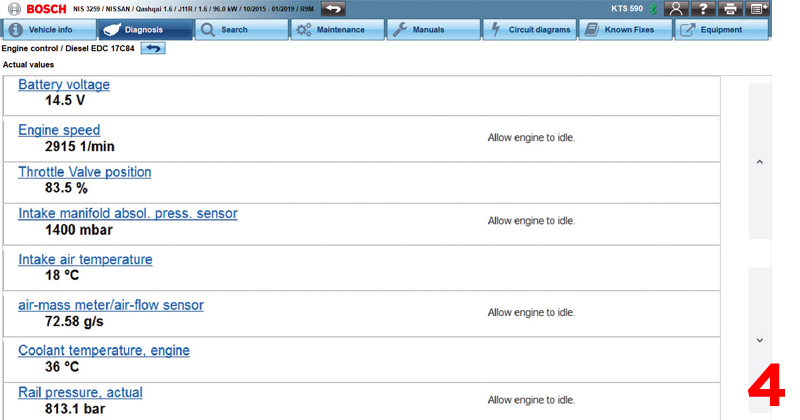
Once you have made your selection, clicking ‘continue’, pressing F12 or hitting the enter key, will show you the values on screen in a text format. Each AV will have the name, value, unit and possibly a hint such as “allow engine to idle” displayed. At this point, you will see the value changing as the parameter data is refreshed (Fig.4).
Using the ‘save F2’ soft key at any time will add the data on screen to the job protocol. After some time has elapsed, pressing the F3 soft key when viewing the AVs will allow you to cycle through the maximum, Minimum and current values collected since the data stream was started – a very helpful tool if you are looking for a value that is operating outside of its expected threshold.
For example, if the turbo of an engine system was over-boosting on a road test then you will see, via the F3 maximum key, that the tolerance boost value was exceeded at some point. Without having to constantly monitor the changing value stream you may identify a momentary value that could have otherwise been missed.
You will also notice that there are up and down arrows on the right side of the screen that will enable you to scroll to the next or previous values from the AV list.
Benchmarking against expected values
Sometimes when investigating a fault on a vehicle there is a physical symptom present, but no diagnostic trouble codes stored. If you decide to investigate the AVs of the system for any anomalies and you have a valid licence for ESI[tronic] 2.0 manuals, you can now click on the blue underlined AV name to see the functional description of the associated component and any expected values for the conditions. A favourite AV feature included in ESI[tronic] 2.0 is the ‘F6 – time profile’ soft key. By changing the display of AVs to a colourful graphical format that plays across the screen you can configure the data presented to best suit your requirements.

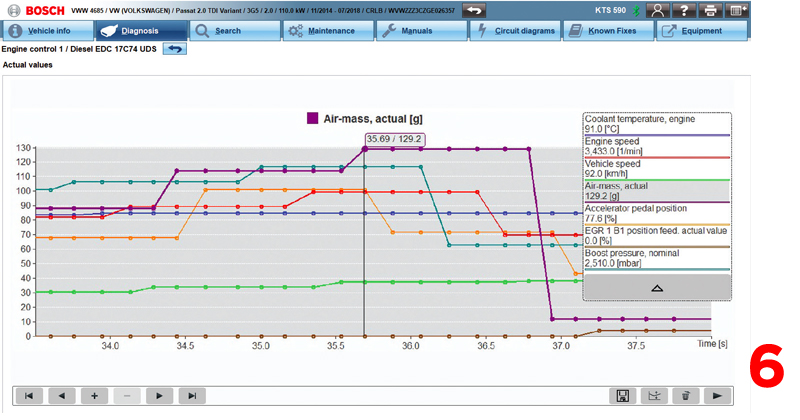
The time base can also be adjusted between 5 to 60 seconds to zoom in or out of the graph on screen. Pressing the ‘pause’ key will stop the data collection at that point and the buffer memory will store up to approximately the last six minutes, depending on how many values were selected (Fig.5). Allowing you to play back the capture in a sequence – or scroll through the data screen-by-screen – and then zoom into millisecond detail if needed (Fig.6).
The information you need
It is easier to identify a problem when you can clearly see the relationship between components in operation together. Depending upon the system and fault that you’re investigating, the applicable values can be viewed together in one graph. For example, the accelerator pedal position, air mass meter flow, EGR valve actuation and boost pressure on a common rail diesel engine during acceleration.
Clicking ‘F4 save’ during an AV time profile will take a static screen capture of the data graphing on screen and add it onto the protocol report which can be saved and printed off for reference.
Along the bottom you will notice an icon that looks like a floppy disk symbol, called ‘data recording’, which will save a flight recorder style file of the current time profile data collection. You can save, open, review and play back the data recording at any time.
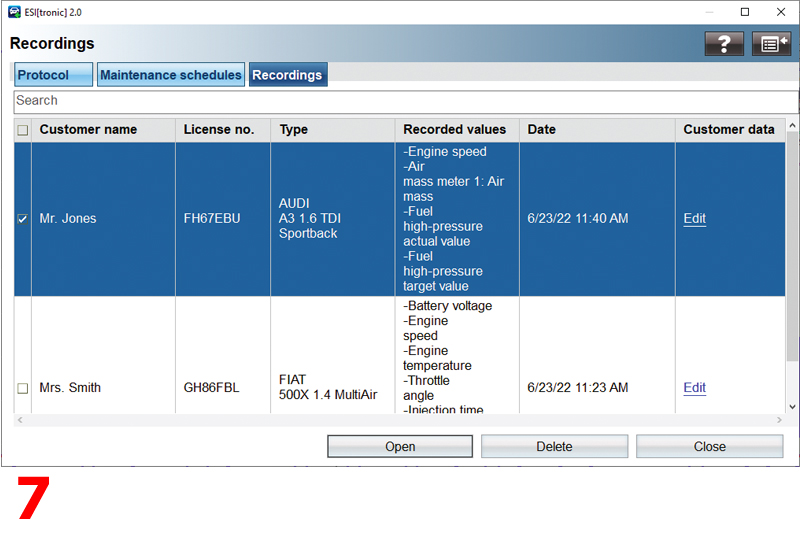
A useful feature if you are searching for an intermittent fault and wanted to first record the event occurring out on the road and later view and analyse the results back in the workshop. The file at that point will be saved in the ‘recordings’ tab (found in the ‘main menu’ under the ‘protocols’ section) (Fig.7).
Finally, you can also add important information, such as customer and vehicle reference, to be able to later identify the job associated with the file. The ‘actual value’ display features described in this article can be highly useful in automotive system diagnostics by allowing you the versatility to view and store the data from the vehicle in different ways.
Next instalment we’ll be discovering how ESI[tronic] 2.0 can help you overcome stringent and commonplace secured diagnostic outputs to provide customers with a full service.