This second instalment in an exclusive trilogy of oscilloscope guidance clinics from Steve Smith of Pico targets those that fall into the category of users who are competent, but don’t yet fully know how to get the best from their tool… or, in other words, the ‘intermediate’ crowd.
 Steve Smith is a former Toyota Master Technician and winner of the 2013 Top Technician competition. He now puts his extensive knowledge to good use as an Automotive Application Specialist for Pico Technology.
To recap on last month’s ‘Scope School’, you may have experimented with the various techniques we covered when capturing waveforms. The features of PicoScope we touched upon included the Home and Auto icons, and the Automotive presets menu. We also detailed the all-important key elements when going it alone and capturing a waveform from scratch, namely Voltage, Time, Trigger, and Probe.
With all the scope features available, I have to say that the Automotive presets menu are a god-send for any new PicoScope user, so don’t panic. With this knowledge now in place you can move onto further valuable features of PicoScope that will make life so much easier as your experience and confidence grows.
Now you’ve made that all important capture, your job is to evaluate the waveform, and look for the information contained within. Often, at a glance the waveform may look perfectly normal, but analysis is the key to a successful diagnosis and here you will need to Measure and Zoom specific areas of interest within the waveform to reveal the hidden detail. In this example we use a 12 V injector, but the theory behind the tools and their use applies to any signal you capture.
RULERS
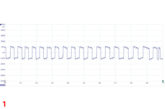
At your disposal you have numerous Signal rulers that will enable you to measure the minimum and maximum values of all waveforms on screen. The image below demonstrates the minimum and maximum values of a 12 V injector waveform using the Channel A signal rulers.
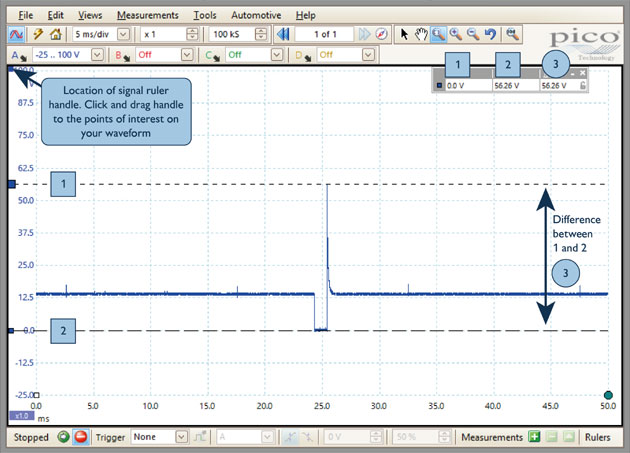
Click on the signal ruler handle adjacent to the top of your vertical scale and drag down to the location of interest within your waveform. Repeat this process to get your minimum and maximum value positions. The numerical value of the position of the signal rulers on the screen will be displayed in the Ruler legend at the top of your scope screen. Each channel has its own set of signal rulers available.
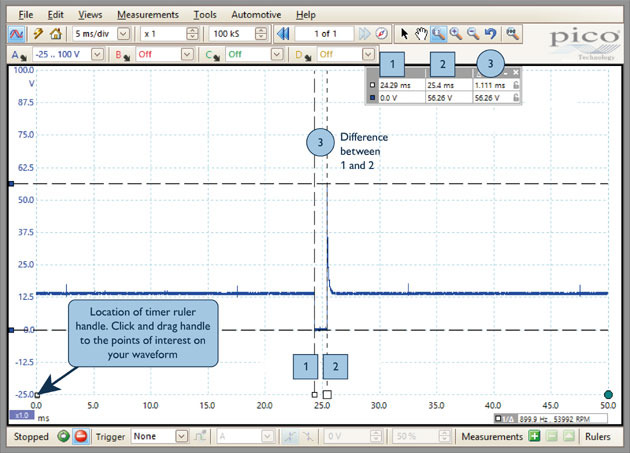
You also have a set of Time rulers to enable you to accurately measure the time of an event within your capture. Click on the white Time ruler handle located at the bottom left hand corner of your scope screen and drag to the start point of interest within your waveform. Then place a second Time ruler at the end point of your area of interest. The numerical value of the position of the time rulers on the screen will be displayed in the Ruler legend at the top of your scope screen (see below).
ZOOMING
Often, the ultimate revelation comes from Zooming into your captured waveform at the point of interest. At first what appears to be irrelevant, upon zooming could be revealed to be the source of the problem. Remember, when zoomed in you can also use the measuring tools above to further evaluate the area of concern.
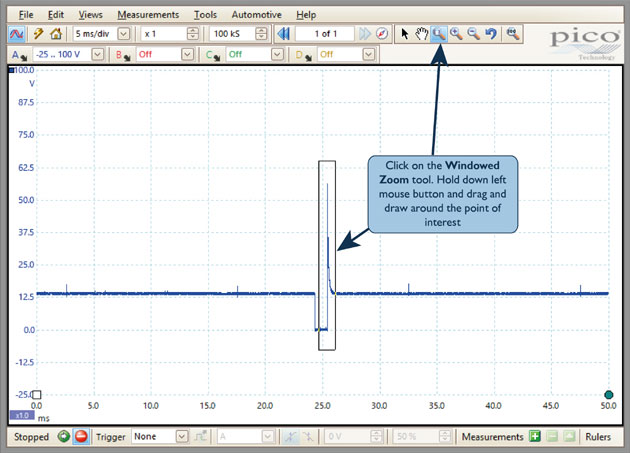
PicoScope has numerous zoom options and we will cover the most popular function here. The Windowed Zoom tool is located in the zoom tool bar; simply click on the icon then move your mouse onto the scope screen. Hold down the left mouse button whilst you drag and draw a box around the area of interest within your waveform. Upon releasing the mouse button the zoom function will enlarge the waveform to show only the area where you drew the zoom box.
Viewing the capture in the image below with no zoom, we are missing a vital piece of information as we cannot see the Injector Pintle Hump, formed when the injector pintle passes through the solenoid winding core on closure, disrupting the magnet field on the way.
Below we can see our injector waveform from above, but this time we are zoomed into the area of interest, revealing the point of closure of our injector.

You’ll also notice the Zoom Overview window that appears on screen, explaining where you are zoomed into with reference to the whole waveform.
CUSTOM STARTUP SETTINGS
In our previous feature we mentioned having your own pre-determined startup settings. These settings will be linked to the Home button within PicoScope, and will be the settings that appear when you open the software.
Firstly, let’s tackle the question of why you would need this feature. Perhaps you regularly use PicoScope for a specific test, one that doesn’t appear in our Automotive menu library. Your test may require several channels to be active with differing input ranges, a complicated trigger, and perhaps even an alarm function (more on these next time!). To set up this test every time you want to capture signals may be time-consuming and probably quite frustrating.
To use this feature, simply set up the test as you normally would, but rather than run the test, choose File > Startup Settings > Save Startup Settings (see below).

Now, each time you open PicoScope or click the Home button, your custom settings will be ready to go.
SAVING AND SHARING
Possibly one of the most simple and beautiful features of PicoScope is the Save facility. This allows you to capture all your PicoScope files (or should I say hard work) and, whilst this seems a simple feature, the possibilities that then open up are invaluable. With your captures saved you then have:
■ A hard copy for your customer.
■ A reference for your own knowledge-base.
■ A comparison waveform (more on this next time).
■ The ability to share with colleagues anywhere in the world and include waveforms in technical reports.
■ The chance to analyse and amend waveforms long after capture, when removed from the hustle and bustle of the workshop (with a clearer head).
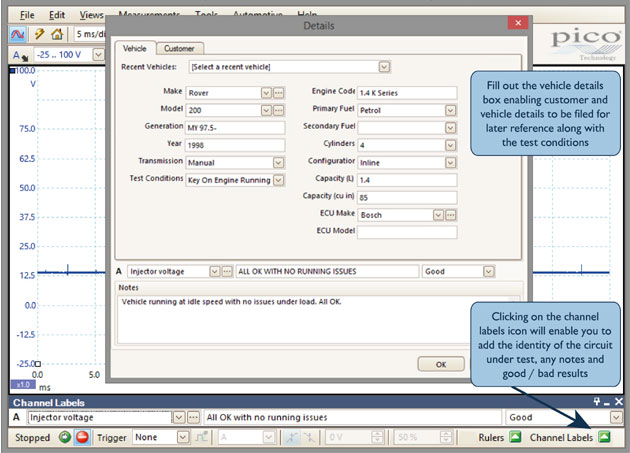
Using the Save and Save As feature will enable you to save your capture with all the relevant information about your vehicle, the test conditions under which your capture was taken and any notes you choose to include about your capture that will become a lifesaver when reviewing files many months after capture (see below).
PUT THIS THEORY INTO PRACTISE
If you’ve read parts 1 and 2 of our ‘Scope School’ feature you’ll now have the knowledge to enable you to capture a variety of waveforms – with or without the use of the Automotive presets. What’s more, you’ll also have the tools to analyse and save waveforms for future reference.