This exclusive trilogy of articles, from Steve Smith of Pico Technology, will offer you a helping hand with getting more from your oscilloscope – whatever your level of experience or expertise. This first part takes a look at the basics.
 Steve Smith is a former Toyota Master Technician and winner of the 2013 Top Technician competition. He now puts his extensive knowledge to good use as an Automotive Application Specialist for Pico Technology.
PicoScope has given technicians the facility to reveal details hidden deep inside vehicle control circuits, accessing a level of detail that could not have been envisaged just 20 years ago.
When we think back to the late 80s and early 90s looking at waveforms displayed on small screens with little colour options, I do wonder how we managed to diagnose anything with reasonable ease and conviction.
Today the sky would appear to be the limit with widescreens, colour monitors, multi channels, high speed capturing, zooming, and more. With the ability to save, share, and store what we have captured for future reference, the advance in the tools of our trade is fantastic.
All these features have made the automotive oscilloscope (scope) user-friendly and, more importantly, the essential companion to the scan tools found in virtually every automotive workshop around the globe.
So how do we harness the power of this essential tool and use it to our advantage, not only to assist with diagnosis but to develop our own personal understanding of control circuits and systems?
FIRST TIME USERS – THE INITIAL CHALLENGES
One thing you can be sure of when using a scope is that it will initially raise more questions than answers, due to the details revealed to you on your screen. This in itself is a challenge but you will discover, as you use the scope and become familiar with the settings and values, that your own knowledge and understanding will begin to take off.
A good tip would be to use the PicoScope on a vehicle with no faults or running issues. Here you can measure whatever circuit you choose and discover how each waveform appears on screen and how they relate to each other (crankshaft and camshaft for example). Connecting the scope to the vehicle and acquiring a measurement does not have to be daunting or something to fear. We’ve been doing this for years with a multimeter and a scope is fundamentally the same tool, but simply displays the voltage measured against time on a larger, graduated screen.
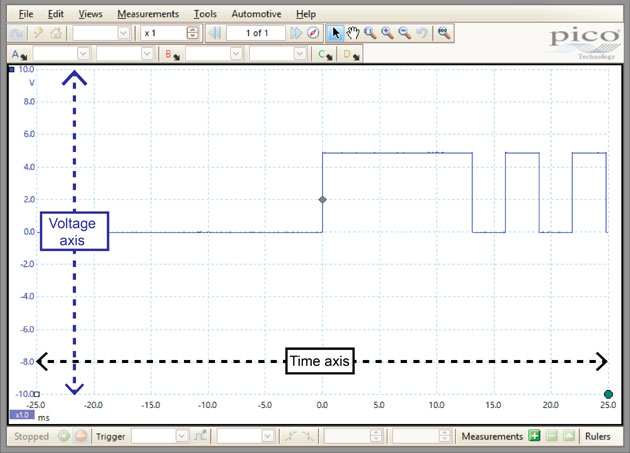
Thinking back to our school days when graph paper was used, we would plot various values against each other. Once complete we would then draw a line connecting them, slowly building a pattern. In the same way as the graph paper, the software displays its data on a grid. The PicoScope grid consists of 10 vertical and 10 horizontal divisions that enable you to track and measure your signal at any point. The voltage range is displayed on the vertical axis and time is displayed on the horizontal axis (see below).
TAKING A MEASUREMENT
PicoScope comes with various features, enabling you to easily capture and display a measurement waveform with little scope knowledge. Grasping the four ‘key elements’: Probe, Voltage, Time, and Trigger will set you on your way to oscilloscope success.
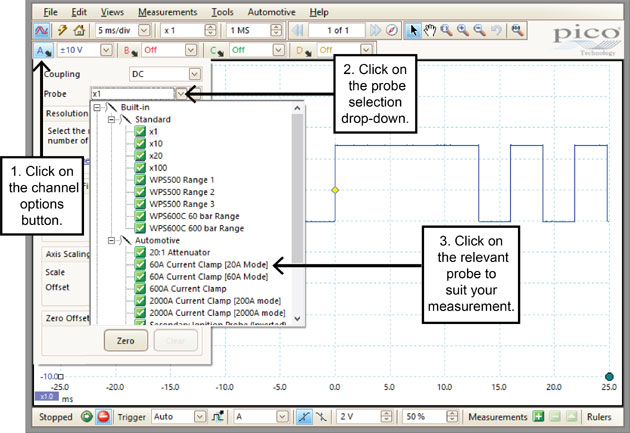
1. Probe
Selecting the right probe is essential as this informs the scope of the type of measurement you are about to take. The probe’s setting tells PicoScope what you are using to take your measurement and how your data needs to be displayed. The x1 probe is often the standard for the majority of voltage measurements, and conveniently is set as the default probe selection. With the x1 probe selected, PicoScope sets the scale and unit values for a voltage measurement. However, selecting the 60 A current clamp from the probe drop-down menu adjusts the scale and unit values to correctly display a current measurement (see below).
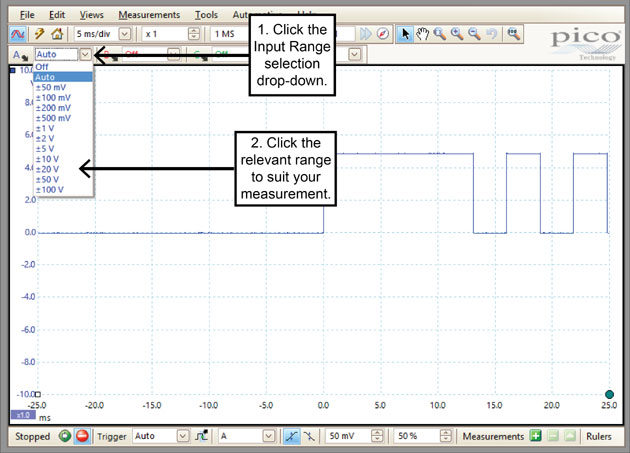
2. Voltage
With voltage we must remember 1 V is equal to 1,000 mV. The voltage setting is no different to your multimeter when it comes to selecting range. Just as you would turn the dial on your multimeter to the relevant scale, click on the Input Range drop-down to select the voltage range you require (for 12 V systems this is typically ±20 V). This will now set your scope screen to display any voltage that falls between +20 V and -20 V. Each division on your vertical axis now has a value of 4 V (-20 to +20 V = 40 V range, divided by 10 divisions = 4 V per division) (see below).
3. Time
Selecting the time for a measurement is a feature you will have not considered when using your multimeter, as the value displayed on your meter screen would have been an average over a pre-set time. This is the fundamental flaw of using a multimeter when measuring voltages that change rapidly over time.
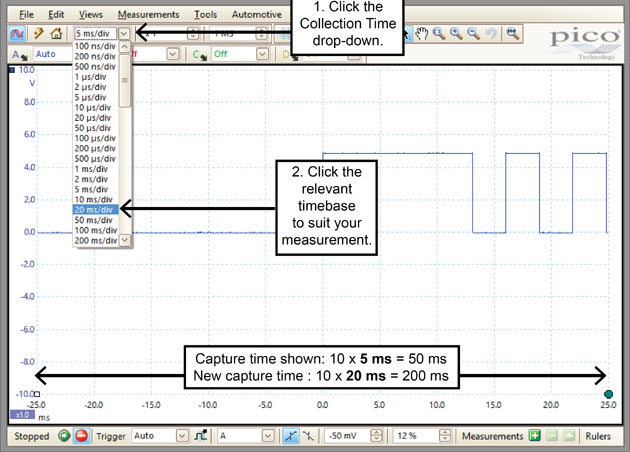
As a general rule of thumb for measuring vehicle circuits we use the 20/20 rule which means ±20 V and 20 ms/div. To select the relevant timebase click on the Collection Time drop-down and select 20 ms/div.
Each division on your horizontal grid now has a value of 20 ms, meaning your scope screen will display a timebase of 200 ms (200 ms timebase divided by 10 divisions = 20 ms per division). 20 ms/div is chosen as the general timebase setting to enable the scope to capture all events that take place during the 4 stroke cycle on one screen. This will ensure you miss nothing from injection to ignition events. Two valuable points to remember here are: a) the four stroke cycle takes 150 ms to complete at 800 rpm; and b) 1 second is equal to 1,000 milliseconds.
To view more detail of a single event, reduce the timebase. To view more events with less detail, increase the timebase (see below).
4. Trigger
The trigger feature will enable you to stabilise and display your waveform on screen at precisely the right time during the signal capture. Whilst there are numerous trigger features available to you with PicoScope, we will cover: Auto trigger mode, simple Edge, and trigger Threshold options. When looking at voltage signals that change rapidly over time, they will appear to shift or jitter about your screen, making them very difficult to view and analyse in real time. To overcome this issue you can specify the conditions that must be met before the signal is displayed on screen. The waveform (see below) is a square wave, duty cycle control signal.
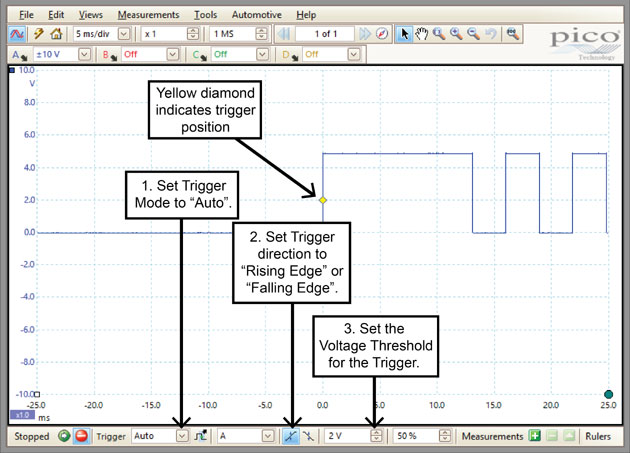
A. The first trigger condition is the Trigger Mode and for this example we will select Auto. Selecting Auto will force the scope to wait for the trigger conditions to be met before displaying the waveform on screen. However, if the conditions are not met within a set time, PicoScope will display the waveform regardless. This is a great feature when using triggers for the first time as it will allow the scope to display a waveform, even if you have set your trigger conditions outside the values for the signal being measured.
B. The second trigger condition is the direction of trigger. Do you want the trigger to capture the signal when it is increasing (Rising Edge) or decreasing (Falling Edge)? In the case of our square waveform it does not really matter as we know the square waveform has both these rising and falling edges.
C. The third trigger condition is the Threshold – the voltage level that has to be crossed in the direction specified in step b. Clicking the threshold arrows in the triggering toolbar will increase or decrease the voltage level required before the waveform is displayed on the screen. The selected threshold voltage is displayed adjacent to the threshold arrows and a yellow diamond will appear on screen identifying where the threshold voltage has been set.
To recap: Auto trigger mode has been selected. PicoScope will wait for a signal to cross a Threshold of 2 V, travelling in the Rising Edge direction. Due to Auto trigger mode being selected, if these conditions are not met, a signal will still be displayed after a short period of time, regardless of the conditions set.
SETTINGS SUCCESS
With the aforementioned knowledge in place, you have a solid foundation to set your scope to capture virtually any signal, but don’t worry if this all seems like information overload as help is at hand.
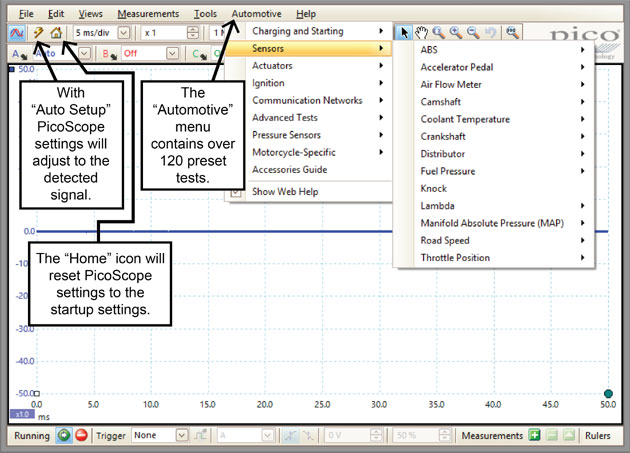
Within the PicoScope screen you will find an Automotive menu. This menu will reveal a host of preset tests for almost any component you wish to test on a vehicle. The preset help file will explain all about the signal under test and how to connect your scope. More importantly, the preset configures PicoScope to capture the relevant signal so that Probe, Voltage, Time, and Trigger settings are all taken care of.
Should you wish to go it alone, and set PicoScope manually, and the waveform does not appear as expected, or worse still, does not appear at all, you can gain additional assistance. Clicking the Auto setup button will automatically select the settings to capture the signal under test. Alternatively, clicking the Home button will set the PicoScope settings to their default start-up settings, or your own predetermined start-up settings (see below).