It is no secret by now that amongst the numerous accessories to accompany PicoScope, the NVH Kit (Noise Vibration Harshness) is one which introduces a whole new dimension to diagnosis in which technicians are only scratching the surface.
This case study, carried out by Pico, looks at a MK5 VW Golf 2.0 TDI with a distinct vibration throughout the cabin at a very specific road speed range of 67 ‐ 73mph. This presented a real nuisance at cruising speed and resulted in the customer driving at 65 or 75mph to avoid the vibration. The vibration was not evident through the steering wheel and the customer confirmed all 4 wheels and tyres had been balanced.
With any form of diagnosis, confirmation of the symptom with the customer is critical and never before has this been more essential than when investigating NVH. I mention this now because our perceptions of noise and vibration differ from one individual to the next.
What might appear a nuisance to the customer may in fact be a vehicle characteristic based on the experience of the technician. Until now, proving this fact to a customer was dependent on the rapport and trust of the technician with the customer.
Now, with Pico’s NVH kit we can take a physical measurement of the vibration level and present the customer with factual evidence from their vehicle or even from a donor vehicle (when a comparison is required). This enables you to explain whether the vibration level is a characteristic of that vehicle or requires a component to be replaced or repaired, identified from the frequency of the vibrations detected.
So how does the NVH kit detect and identify the numerous vibrations present in a vehicle?
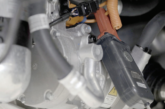
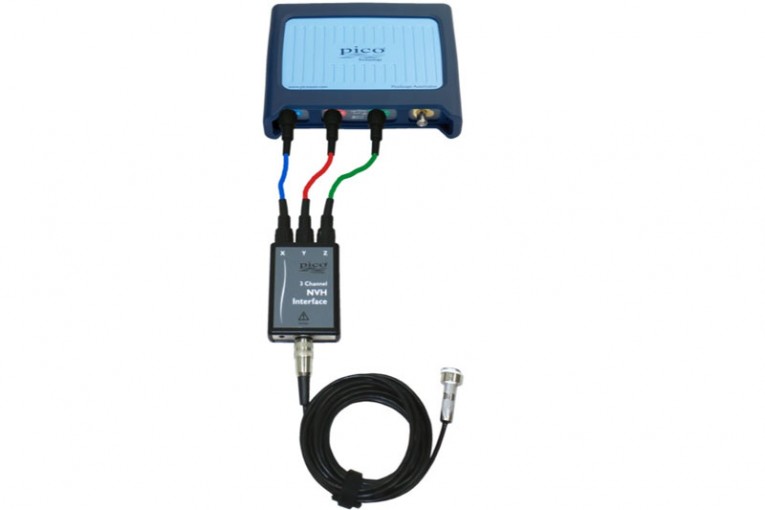
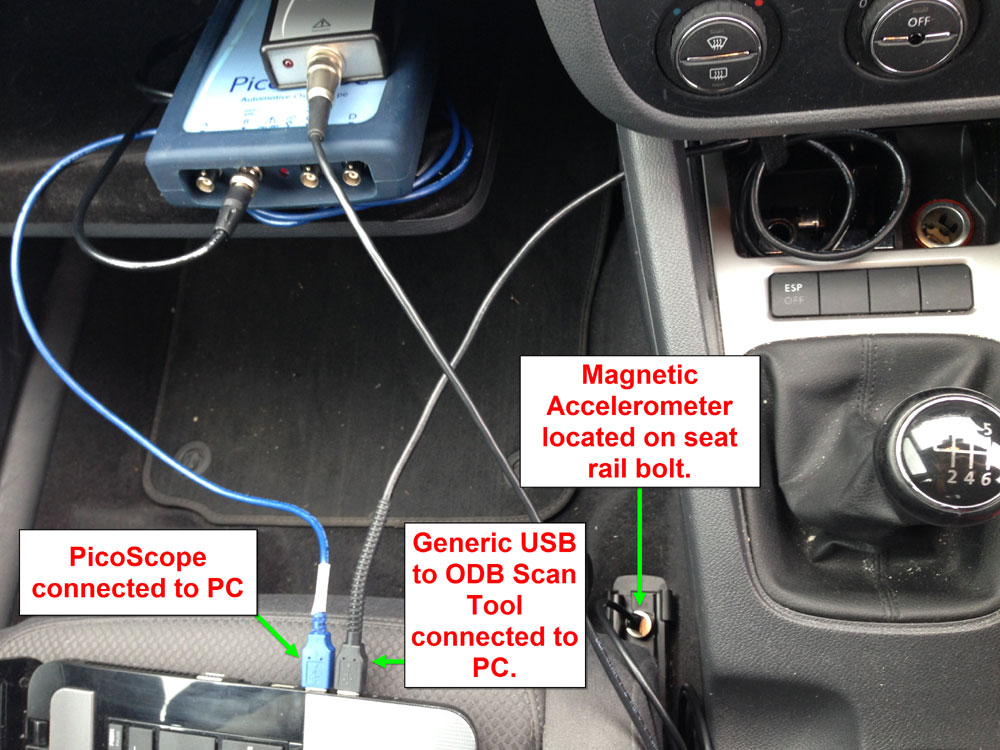
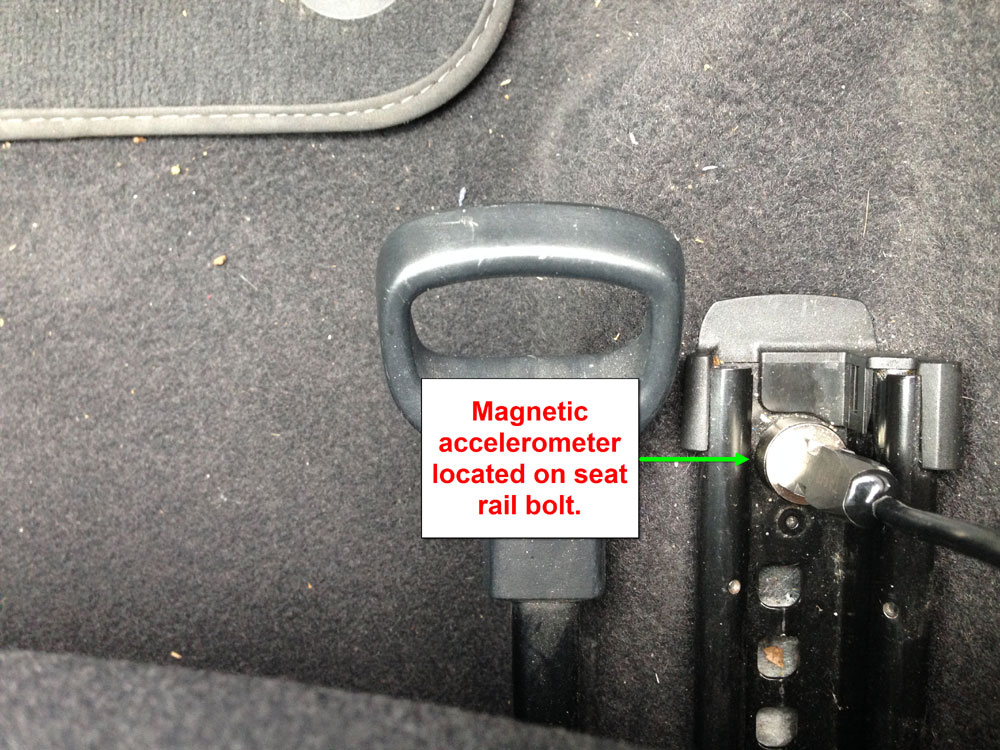
To help answer this, the NVH kit was installed to the aforementioned VW Golf. The kit contains a magnetic base accelerometer that is generally mounted onto the driver’s seat rail mounting bolt. This is due to the mounting bolts direct location to the chassis and the area of reported vibration by the driver. This location provides an initial bench mark for vibration measurements (the NVH kit also includes a microphone for measurements of audible noise).
The accelerometer is then connected to the NVH interface box which in turn is connected to the PicoScope via a BNC lead to Channel B. Any vibration detected by the accelerometer is then sent to Channel B via the interface.
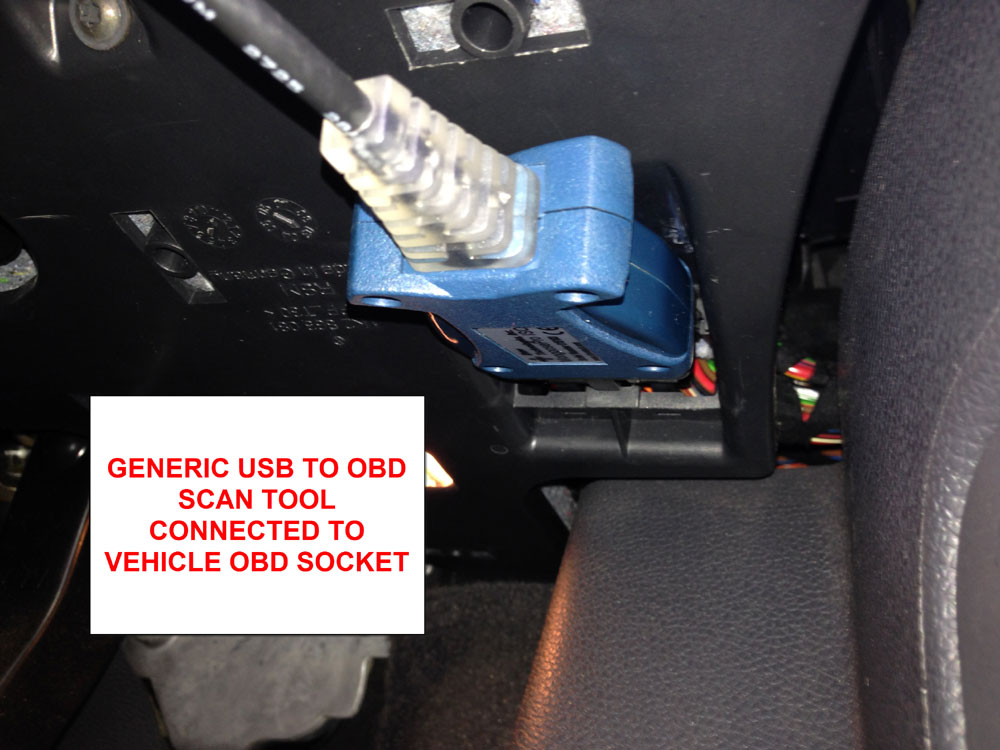
The final connection is the generic scan tool USB to OBD lead (not supplied with the NVH kit) connecting the PC to the vehicle OBD system. The scan tool lead provides the NVH software with engine speed and road speed data (if available) enabling the software to calculate the rotational speeds (frequencies) of numerous components.
N.B The NVH software will allow other forms of engine speed detection to be used if a scan tool or live data is not available.
With all connections made, the NVH software is launched and the all‐important Setup procedure followed. At this point I cannot stress how important it is to enter as much valid information as possible during the set up process, as all calculations made by the software regarding vibration frequencies are dependent upon accurate vehicle specifications.
The NVH software uses the engine speed and entered Vehicle Information (gear/drive ratios) to calculate the rotational speeds of the drive train. As technicians we always refer to rotational speed in revolutions per minute (RPM), however RPM can also be expressed as revolutions per second if we divide any RPM figure by sixty. E.g. 3,000 RPM / 60, gives 50 revolutions per second. We know 1 Hz is one cycle per second, so we can express 50 revolutions per second as 50 Hz.
Our engine is therefore running at 3,000 RPM or 50 Hz, the speed and frequency of a component are one and the same.
An engine rotating at a speed of 3,000 RPM is rotating at a frequency of 50 Hz (50 rotations per second) and this formula goes for any rotating component on our test vehicle.
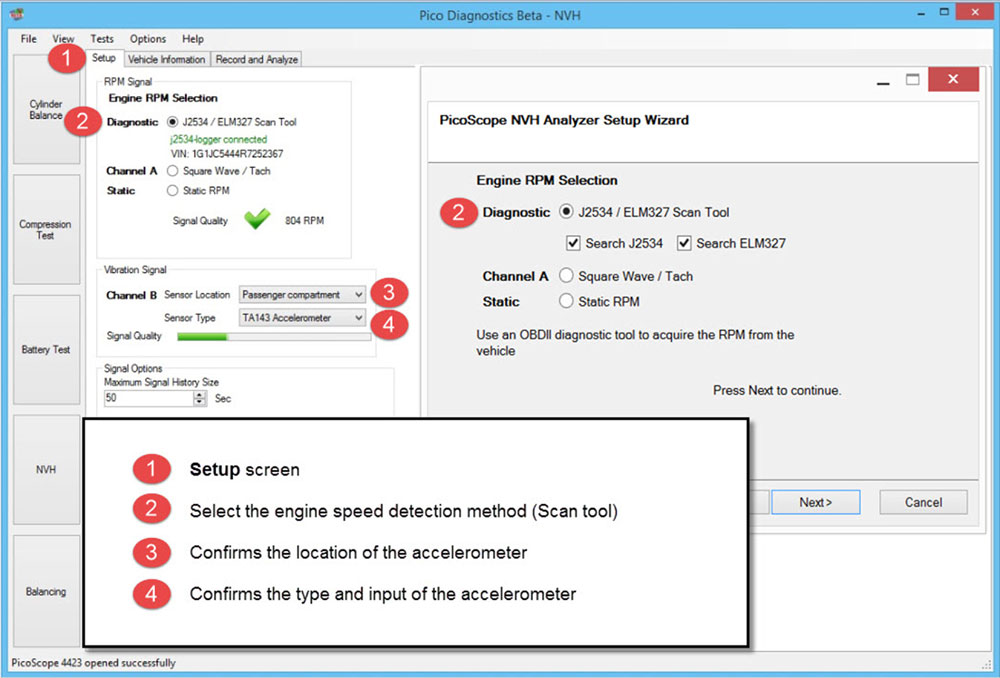
PicoScope NVH Analyser Setup Wizard
Setup Tab
Below is a typical Setup screen confirming the engine speed detection method, accelerometer type, location and function.
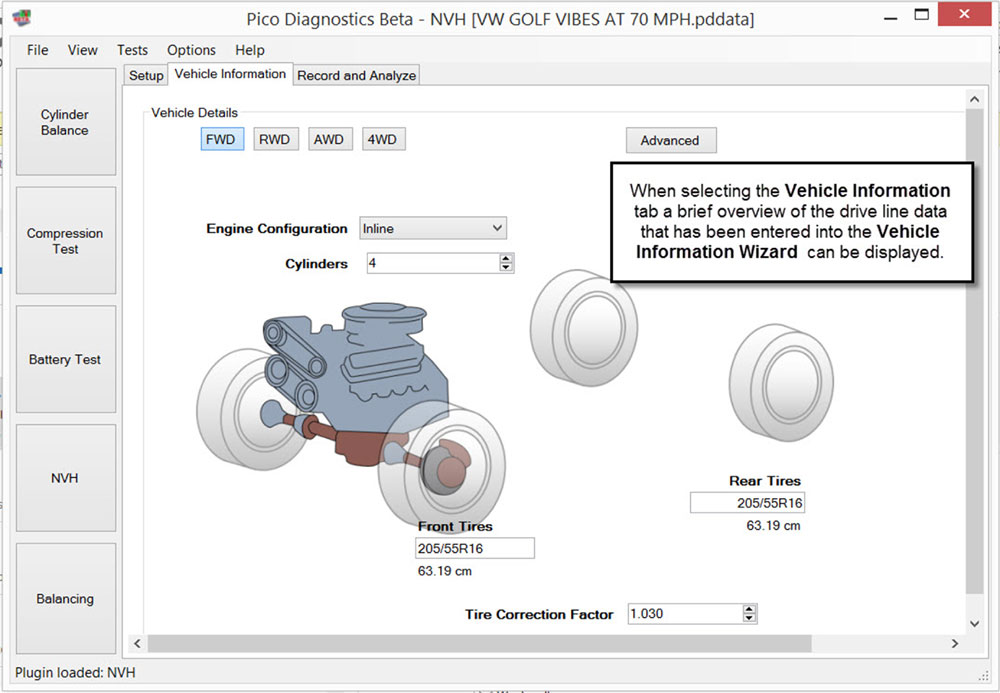
Vehicle Information Tab
The Vehicle Information Wizard allows for vital drive line information to be entered including, engine configuration with number of cylinders, transmission style, gear count and ratios (optional if road speed is available from OBD II), drivetrain arrangement, final drive ratio, tyre size, and finally accelerometer type, and location.
The image below displays a pictogram containing a summary of key information entered into the Vehicle Information Wizard.
Whilst I have mentioned above that entering gear ratios are optional I would always recommend when looking for road speed related vibrations that as much information is entered into the software as possible. Entering the gear ratios allows the software to calculate the gear selected and will automatically display and announce the gear shift during acceleration/deceleration allowing for easy auto capture of data with a clear reference of the gear selected at any given time during the road test.
Record and Analyse Tab
Once all the data had been entered a road‐test could be carried out at 70 mph to Record and Analyse the data obtained.
At this point it is well worth discussing how the NVH software can calculate driveline component frequencies and identifies specific vibration levels based upon the engine and road speed data provided via the OBD II connection and the entered Vehicle information (this will most certainly help with interpretation of the up and coming results).
Example of NVH software frequency calculation based upon the following vehicle information:
- Engine at 50 Hz
- Transmission 3rd gear ratio 2:1
- Final Drive ratio 4:1
With engine at 50 Hz into transmission, the engine, flywheel, clutch and transmission input shaft rotate at 50 Hz and any vibrations occurring at 50 Hz are related to these components.
Input into transmission at 50 Hz / 2:1 (3rd gear ratio) = 25 Hz. Therefore transmission output shaft and propshaft rotate at 25 Hz and any vibrations occurring at 25 Hz are related to these components.
Propshaft at 25 Hz / 4:1 (differential ratio) = 6.25 Hz. Therefore differential crown wheel, drive shafts and road wheels rotate at 6.25 Hz and any vibrations occurring at 6.25 Hz are related to these components.
The software can identify these key frequencies and provide the user with identification abbreviations to assist with diagnosis. E.g. E1 First order engine vibration T1 First order tyre speed related vibration.
Results below were obtained from the VW Golf with vibration evident throughout the cabin at 70 mph.
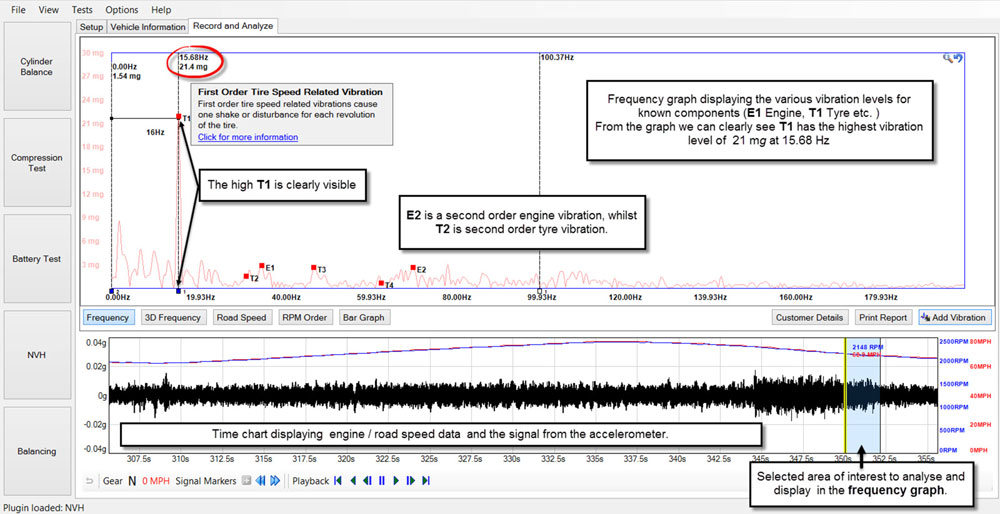
Looking at the screenshot above we were able to clearly measure a vibration level of 21.4 mg from the accelerometer attached to the seat rail at 69 mph (speed reported by the customer). The NVH software is able to process the numerous vibrations detected by the accelerometer and display them in order of their frequencies, so identifying specific components based on engine speed and the Vehicle Information entered. In the case above a T1 (First order tyre speed related vibration) is responsible for the complaint.
So how did the software identify T1?
Using the vehicle information the formula follows the path below to identify T1:
T1 vibration level is excessive compared to all other vibrations (21.4 mg at 15.68 Hz)
Average engine speed: 2000 rpm / 60 = 33 Hz (approx.)
33 Hz into 6th gear (ratio 0.638:1) 33 Hz / 0.638 = 51 Hz (approx.)
Transmission output shaft 51 Hz into differential (ratio 3.238:1) 51 Hz / 3.238 = 15.75 Hz ‐ the approximate frequency of our wheels/tyres.
What is invaluable at this point is not what is causing the vibration but more “What is not?” How many times have we balanced four wheels/tyres to find the vibration is still evident? In this scenario without a vibration analysis solution we would have to assume the vibration level is a result of propshaft or engine mounts and had a tough decision to make as to what component to replace or balance with no supporting evidence.
So, now time to recap on the original symptom and evaluate the test results. We know the vibration is evident through the cabin and not through the steering at 70 mph (hence this is not a front tyre issue).
Our test results confirm a vibration level of 21.4 mg at 15.68 Hz and this aligns perfectly with T1 First order tyre speed related vibration.
So now we know that whatever is the cause of vibration, it is not engine or transmission up to the crown wheel of the differential. This information in itself has saved hours of turmoil and guess work.
We therefore know that whatever is rotating at a frequency of approx. 15.68 Hz is the cause of our vibration. This includes wheels, tyres, drive shafts, and differential/crown wheel.
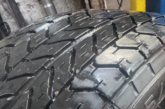
Keeping it very simple, a close inspection of the tyre run‐out revealed an ovality on the inner edge of the OSR tyre.
Whilst the tyre wear pattern in the video suggested excessive negative camber, further inspection confirmed a broken coil spring which of course has the side effect of lowering the suspension and increasing negative camber. A combination of a continually loaded boot space, a broken coil spring and daily motorway journeys of over 100 miles have taken their toll not only on the suspension but the structure of the tyre resulting in the ovality generating a flat spot about the tyre circumference.
A new OSR tyre was therefore installed, along with two rear coil springs.
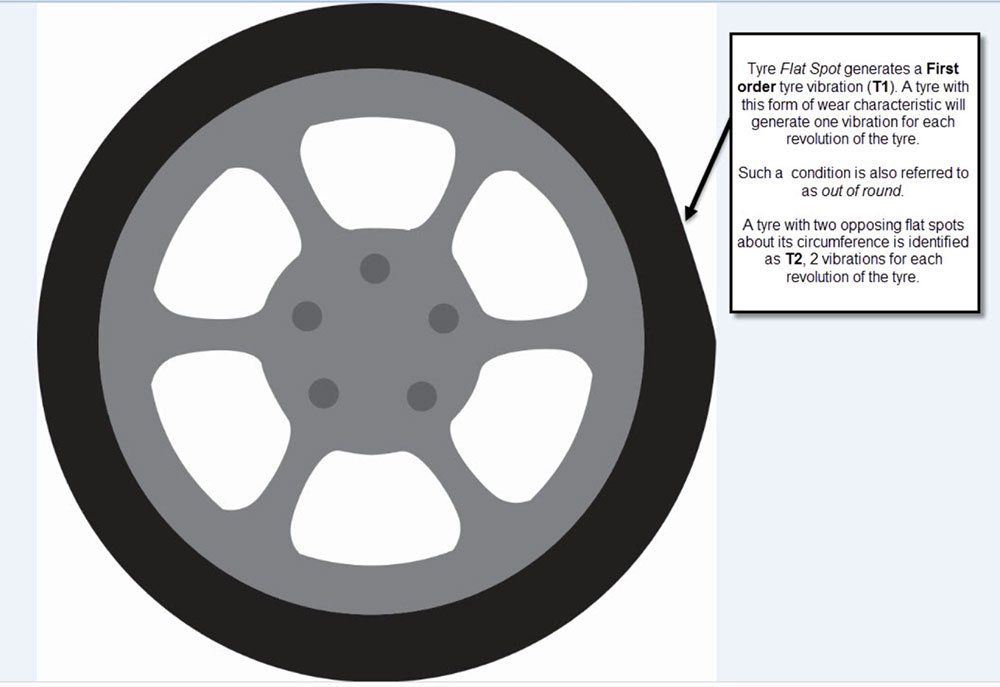
T1 is described as a First order tyre speed related vibration and so therefore it goes without saying T2 would be a Second order tyre speed related vibration, generating two vibrations per revolution of the wheel.
This information will prove invaluable when looking at various vibration conditions that highlight excessive T2 levels allowing the technician to look for specific tyre characteristics or shape. Remember T1 and T2 refer to tyre speed related vibrations which include not only the tyre but components rotating at tyre speeds such as driveshafts and differential/crown wheel.
A road‐test was carried out after the fix matching the results obtained from the initial capture and the conditions mentioned by the customer. See below:
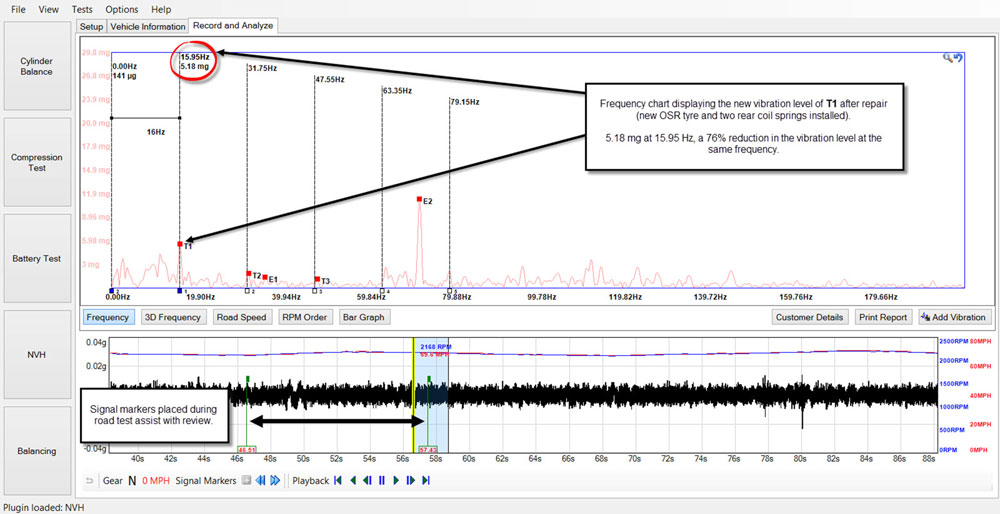
From the image above we can see how the vibration level has fallen by 76% as a result of installing the new tyre and coil springs. This presents undeniable evidence to customers of before and after fix test results that demonstrate the efficiency of your workshop, best practice followed, the professionalism of the technicians involved and not only confirmation of a repair well done, but a historical vibration overview of the vehicle condition at the time of completion. This covers not just the complaints reported by the customer but all components across the frequency spectrum (engine/driveline components and unknown vibrations that may require further attention with customer permission).
The ability to rapidly analyse and identify vibration levels presents opportunities to indicate to customers potential areas of concern that require attention or monitoring. Dual mass flywheels spring to mind given the potential for failure depending on driving conditions. Routine maintenance work could also incorporate an NVH overview/assessment that can be presented to customers on completion of service work with the results based upon a data base built by the garage in question and their product knowledge of the vehicles involved.
This completes the case study of the vehicle above along with a general overview of the NVH software used to diagnose the customer’s complaint.
For more information on some additional features and characteristics of the NVH software, visit the Pico website and scroll towards the bottom of the page.
Note: The unit of measure used throughout this case study is mg. This refers to 1 thousandth of a g, where g is the gravity of Earth and refers to the acceleration that the Earth imparts to objects on or near its surface.