We follow up on last month’s case study from Pico Technology detailing Ives Garage’s diagnosis of a Honda Civic experiencing abnormal levels of vibration whilst accelerating.
Welcome back. Hopefully by this point you will have read part one (if you haven’t, you can read it here and watched the video showing the vibration beneath the vehicle alongside the live NVH data. In the video, you will note how the engine physically moves in a repetitive lateral direction during acceleration and returns to rest during deceleration. Focus on both screens between 11 and 30 seconds. The NVH file in the video highlights the lateral movement of the engine, which in turn is responsible for what we feel in the chassis.
The keen-eyed among you will have spotted that Channel C in the video is returning a huge lateral vibration level, above 229 mg.
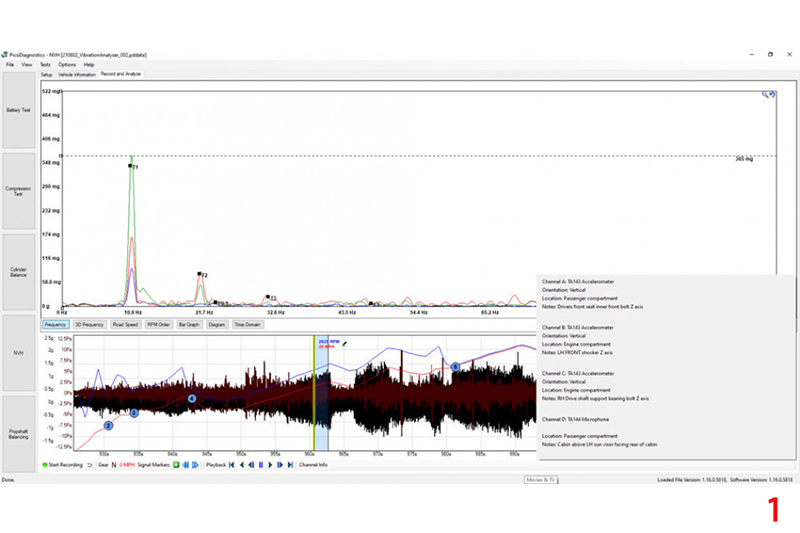
We relocated the accelerometer that was connected to the right-hand front shock absorber to the right-hand driveshaft support bearing, which was attached to the cylinder block. (Channel C below = 365 mg.)
Fig.1/main image shows a screenshot from PicoDiagnostics NVH, showing the recorded data after relocating the accelerometer from the right-hand shock absorber to the righthand driveshaft support bearing.
Regarding the T1 amplitude recorded above, I would like you to think for a moment about the energy level required to repeatedly move an engine and transmission assembly side-to-side at a frequency of 10 cycles per second. If you were to repeat this process manually with a prybar, the effort required would be immense and no doubt physically challenging.
So, what component on our drivetrain could create enough energy to move the engine/transmission in a lateral direction?
Let’s recap:
- The engine/transmission assembly was forced in a lateral direction under acceleration
- We detected T1, T2 and T3 vibration orders, but the main offender was T1
- The accelerometer connected to the lefthand shock absorber indicated energy spikes
- The wheels/tyres required attention but were not responsible for the lateral engine movement
- The offending component was rotating at road wheel frequency/speed
When reading the recap above, the only components capable of developing such energy are the driveshafts. But which one was causing our problem?
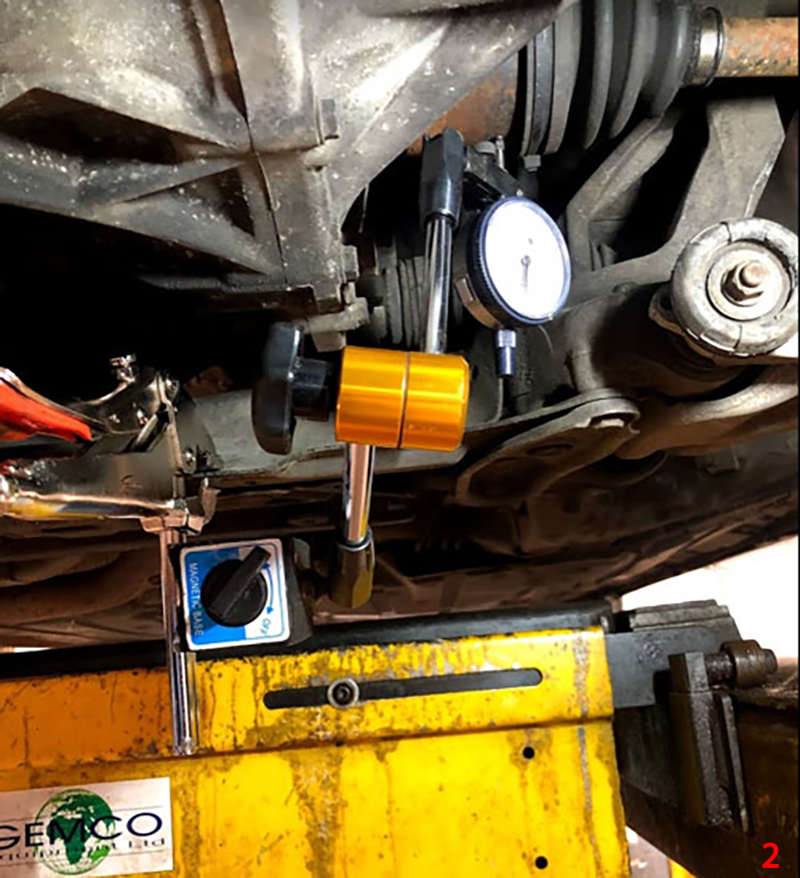
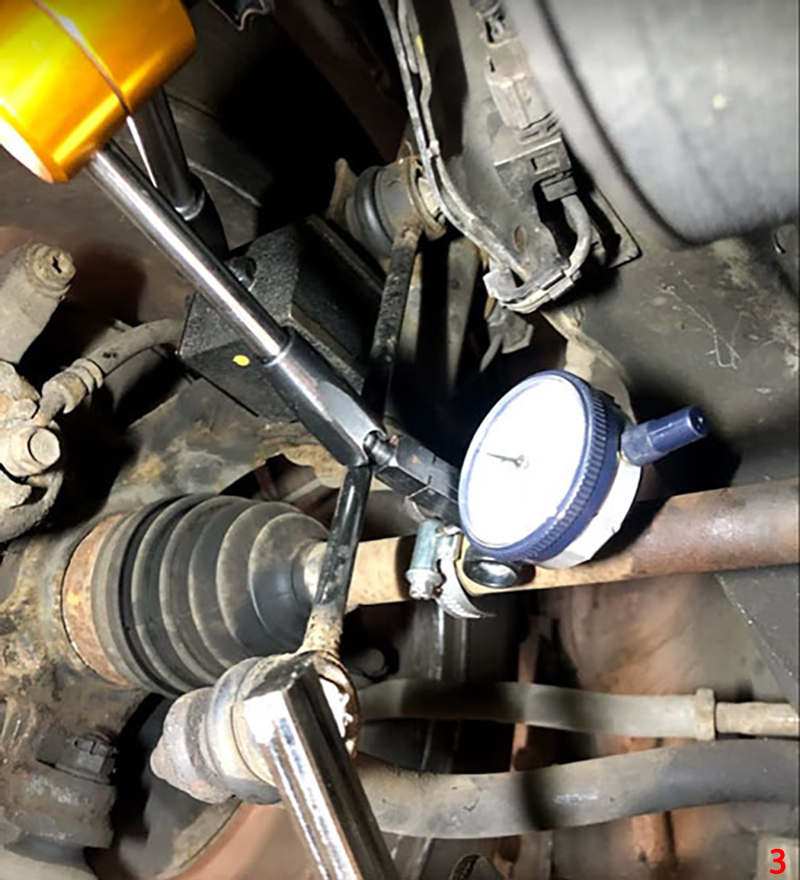
We carried out radial, lateral and axial measurements on each driveshaft in an attempt to differentiate the levels of wear between the shafts (Figs. 2&3).
The measurements revealed the following:
On the left:
The inner driveshaft joint lifted (within transmission) 1.20 mm.
The axial movement between the inner and outer driveshaft joints was 0.95 mm.
The radial runout of the shaft was 0.60 mm.
On the right:
The inner driveshaft joint lifted (in the extension shaft) 0.55 mm.
The axial movement between the inner and outer driveshaft joints was 0.90 mm.
The radial runout of the shaft was 0.70 mm.
Based on the amount of lift in the inner drive shaft joint (the majority of which is within the differential carrier bearings), I leaned towards the removal and inspection of the left-hand driveshaft.
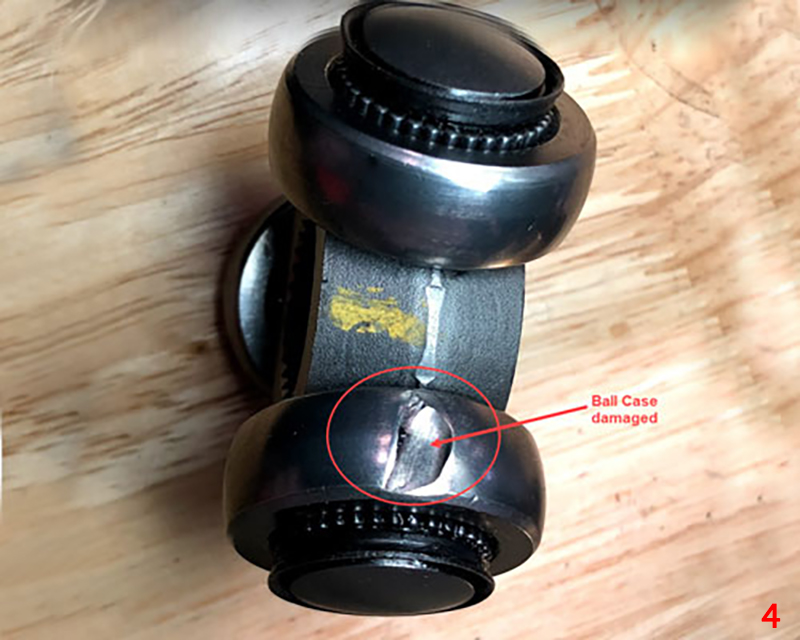
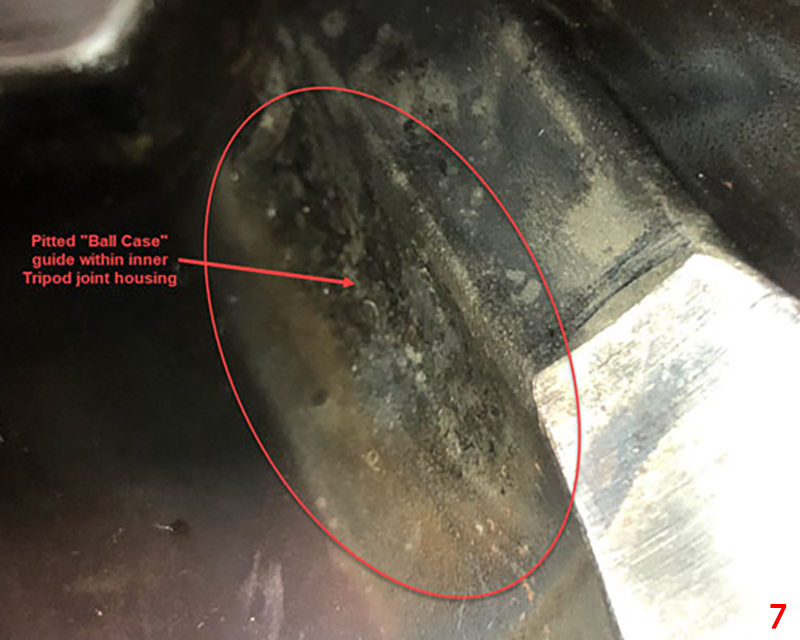
From a PicoScope measurement perspective, it was difficult to determine which was the offending shaft from the Frequency view alone. However, by using the Time Domain view, the energy spikes described earlier in this case study were used as further evidence to support the removal and dismantling of the left-hand driveshaft’s inner tripod joint. Figs. 4-7 reveal a multitude of sins, including damage to the ball case, spider and the inside of the tripod joint housing.
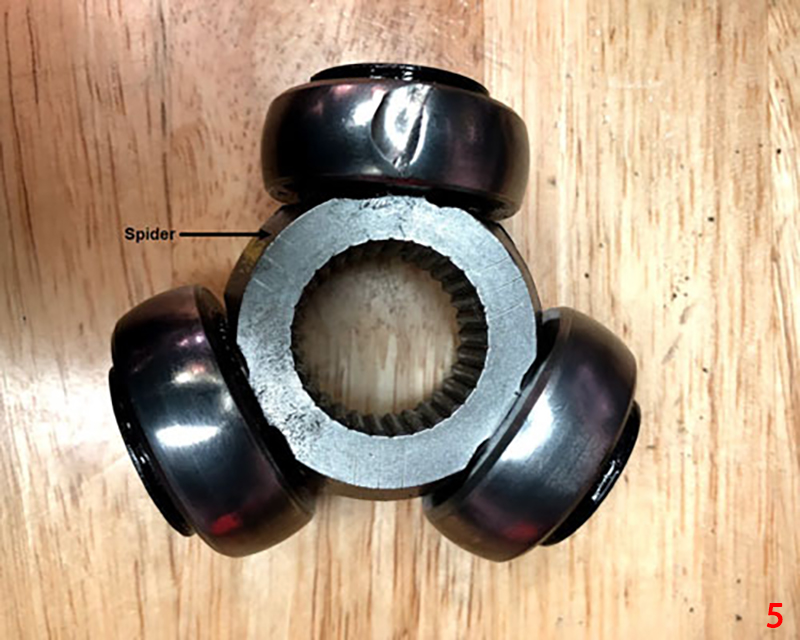
Tripod joints are typically responsible for three disturbances for every one revolution of the road wheel (T3). However, the images above reveal considerable damage to a single ball case and the associated guide in the inner tripod joint housing, which would create one disturbance per revolution (T1).
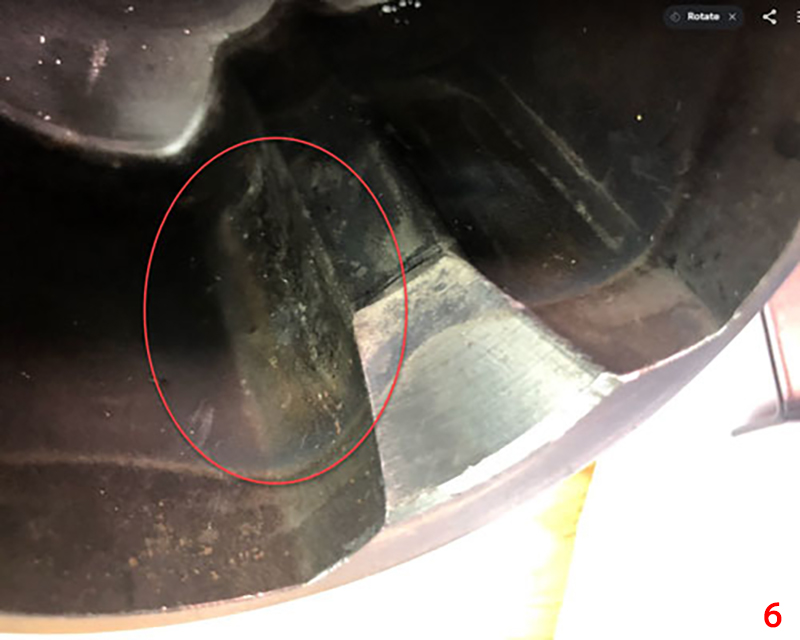
Looking at the joint guide, it would appear that the ball case may have been sticking, dragging or locking against the guide under the transfer of load when accelerating. This could explain why the fault was occasionally intermittent and temperature-related.
Such an event would have the potential for a repeated push-back against the final drive instead of the desired seamless axial movement of the spider inside the joint. The result here would be the repeated lateral movement of the engine/transmission that we captured on camera.
We replaced the left-hand front driveshaft and measured for radial, lateral and axial movement again.
On the left:
The inner driveshaft joint lifted 0.90 mm (within transmission). A reduction of 0.30 mm.
The axial movement between the inner and outer driveshaft joints was 0.45 mm. A reduction of 0.50 mm.
The radial runout of the shaft was 0.60 mm.
Confirmation of repair
Fig.8 captures the T1 lateral vibration level at the right-hand driveshaft support bearing (attached to the cylinder block) at 34 mg. Previously, this was recorded at 365 mg, which equates to an improvement of 331 mg or approximately 89%.

From a human perspective (subjective), the vehicle felt like a completely different car to drive.
Note: the peak at E2. This is normal for a 4-cylinder engine under acceleration (2,874 rpm) due to combustion and is not related to our customer’s complaint.
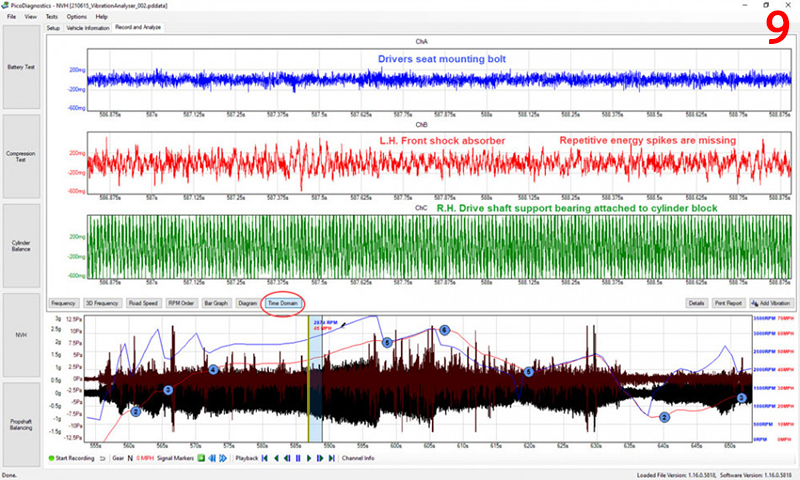
In Fig.9 we view the same vibrations as in Fig.8, but this time in the Time Domain view. Note the absence of the energy spikes (Channel B) and the smoothness of Channel A compared to the Time Domain capture before the replacement of the driveshaft.
Conclusion
There is never time to review why components fail, given the time constraints and pressures of a typical workshop environment. You know the drill: “If it’s fixed, great, get it out and get the next one in”.
I understand this wholeheartedly but let us pause for a moment. Why did the inner driveshaft joint fail in such a fashion? Without any valid vehicle history, we can only assume there had been a previous intrusion, leakage of joint grease, or driver abuse. Road wheel damage is often a clue of the latter. The differential carrier bearings did concern me, based on the amount of lift in the left-hand inner tripod joint (0.90 mm post-fix), but with that said, there were no differential noises and so only time can tell.
When reviewing this case study, it occurred to me just how vital it was to introduce multiple accelerometers and record the data for post-capture analysis in multiple views with included narration. These are all essential features that are not available with NVH mobile phone apps.
The ability to zone into the source of a vibration by using multiple sensors is key to success. Objective data cannot lie and provides measurements as evidence both pre and post-fix for our customers.
I must add that the recent improvements to our NVH software have made this tool a joy to use when road-testing. The M&S hot-key functions we describe here provide a rapid means to marking and saving your data for later review when it is safe to do so.
One final word on post-fix captures. Our customer’s complaint was a severe vibration at 45-55 mph, which is now resolved. Best practice should from now on also include a sweep of vibrations across the entire road/engine speed ranges. This is to make sure that there are no other non-typical vibrations present.

The capture in Fig.10 is one such example, where T1 raises its head again in a lateral direction at the left-hand front shock absorber.
Note: The accelerometer attached to the left-hand front shock absorber captured an increased lateral T1 vibration of 162 mg at approximately 95 mph. Channel C (connected to the right-hand driveshaft support bearing, which is attached to the cylinder block), however, reported only 8.66 mg at this same T1 frequency. (E.g. a minimal lateral movement of the engine.) Therefore, the stronger vibration on the front shock absorber is no longer related to our driveshaft as this vibration is now greater than the driveshaft vibration and most probably linked to our pick and mix array of wheel and tyre errors at high road speeds.
This is proof indeed why a logical approach to diagnosis is essential, as this vibration could be misinterpreted as the initial fault when the facts confirm another component is now responsible for a vibration at the same frequency of the road wheel and tyre.