Pico Technology’s technical specialist Steve Smith provides readers of PMM a comprehensive guide to oscilloscope diagnostics.
There can be no doubt that the automotive service and repair industry has changed beyond all recognition in the last 40 years. The last five years has perhaps seen the largest change, given the exponential growth of electric vehicle sales competing head-tohead with the sale of diesel ICEs. Who could have imagined that statement a few years ago? And who can predict what the next five years in this evolving trade has in store?
With all that being said, one tool has served the motor trade throughout the decades in various forms, with one fundamental principle: to plot signals against time. The tool we fondly refer to as the oscilloscope.
From the late 60s through to the early 80s, oscilloscopes have been used to analyse secondary ignition systems, configure the primary ignition dwell angle and provide a means to qualify ignition timing with combustion quality relevant to mixture content – the process of which was called a “tune up”. The early 80s also saw the meteoric rise of mainstream engine management systems, where the master technicians of the day would comment “cars are becoming too advanced” and “there will be nothing left for us to do now the carburetors and points have gone”.
Roll on to the present day, and similar doom and gloom phrases are flying around again, thanks to the addition of yet another power source in the form of “pure electric”. From my perspective, I cannot think of a better time to join our profession and embrace the opportunities that lie ahead. The role of the technician is more important now than it has ever been and continues to advance thanks to new technologies being introduced into the industry.
Make no mistake, regardless of the power source (ICE or electric motor), vehicles will continue to develop faults and require maintenance. These situations will call for a tool that is steadfast and futureproof, a variation on that classic “tune up” machine, the digital sampling oscilloscope.
As our beloved automotive industry has evolved, so has the demand for oscilloscopes that provide a means to capture and correlate analogue and ultra-high speed digital signals, with superior resolution displayed on crystal clear monitors. That device can only be a PicoScope.
A PicoScope is connected to a PC/Laptop via a single USB cable and controlled by the PicoScope 7 automotive software, which is designed and built from the ground up, with ease-of-use in mind. PicoScope lends itself beautifully to the numerous PC/laptop peripherals at your disposal, in the form of multiple monitors, wireless keyboards, mice, printers, internet access and remote storage.
Whether you are measuring a CAN network, exhaust gas pulsations, vibration via the chassis, or a multi-strike ignition system (all at the same time) you are covered; one might say the PicoScope is the Swiss Army Knife of diagnostics.
After all those sweeping statements, let us focus on several real-life case studies where the PicoScope was used.
ABS warning light illuminated
To cut a long story short, there was no speed signal from the front left wheel speed sensor. The sensor had been replaced with a reputable aftermarket component, along with a wheel bearing containing a magnetic pickup ring. A PicoScope was used to confirm that a speed signal was present at both the sensor and the ABS controller. However, there was still no road speed displayed on the scan tool, accompanied by a relevant fault code for the FL ABS sensor.
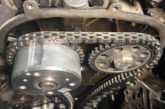
The waveform in Fig.1 was taken from the vehicle’s front left (FL) wheel speed sensor. On the surface, everything looks fine. We can clearly see the speed signal based on the switching current flow through the sensor via a x10 current multiplier. It was only when comparing the current flow through the front right wheel speed sensor that alarm bells started to ring. Once again, everything looks fine on the surface, but a technician with a keen eye would spot that the current flow measurements from each sensor differs!
By using the reference waveform and scaling features in the PicoScope software, we can overlay both the front left wheel speed sensor (magenta) and the front right wheel speed sensor (black) and see the immediate difference.
Focusing on the black signal ruler (horizontal dotted line) of the black waveform in the right-hand image, we have the theoretical crossing point used by the ABS controller to calculate the frequency (approximately 6 mA). Each time the current level rises above 6 mA and then falls below 6 mA, the ABS controller measures the time taken between each of these events and calculates the frequency and, subsequently, the wheel speed. The signal voltage of the magenta waveform never crosses the theoretical crossing point. The current remains above 6 mA, and therefore, the ABS controller simply cannot calculate the frequency; hence no speed signal being recorded via the scan tool for the left front wheel, and the generation of the applicable fault code. Replacing the FL ABS sensor for an OE unit cured the issue.
To see the full case study, click here.
Engine management warning light illuminated
A search for diagnostic trouble codes revealed two error codes: P0172 – system too rich and P0106 – manifold pressure implausible signal. After following the relevant flow charts for these codes, with nothing conclusive to indicate the area of the fault, we have to think outside the box.
The engine in our scenario utilises a speed/density engine management system. We have to therefore consider events that would cause both implausible manifold pressure and a rich mixture. If the engine cannot breathe correctly, both these DTCs will be stored, therefore a PicoScope would be used to carry out a dynamic valve timing check.
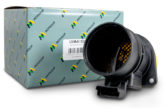
In Fig.2, we have captured our problem vehicle on the left, and compared the cam and crank correlation to a waveform downloaded from a known good vehicle, using the Pico reference waveform library.
Using the tooth count feature (between the time rulers) placed at the rising edge of the crank signal (after the missing tooth) and the first rising edge of the camshaft signal, we have proven our valve timing to be incorrect and hence the cause of our misleading DTCs.
To see the full case study, click here.
A/C communication failure
Given the rise of low to zero-emission vehicles and their accompanying energy efficient ancillaries, here we have a hybrid vehicle utilising a high-voltage motor to drive an air conditioning compressor. The power management control ECU (PMC) reported a communication malfunction (via DTC) with the air conditioning compressor, resulting in the A/C feature being inoperative.
As ever, in order to diagnose a component, we need to know how it works; with our A/C fault we have four wires between the PMC and the AC Compressor. On pin 1 at the compressor we have a “clock” (synchronisation) signal, pins 2 and 3 have a digital communication signal, and pin 4 has a power supply.
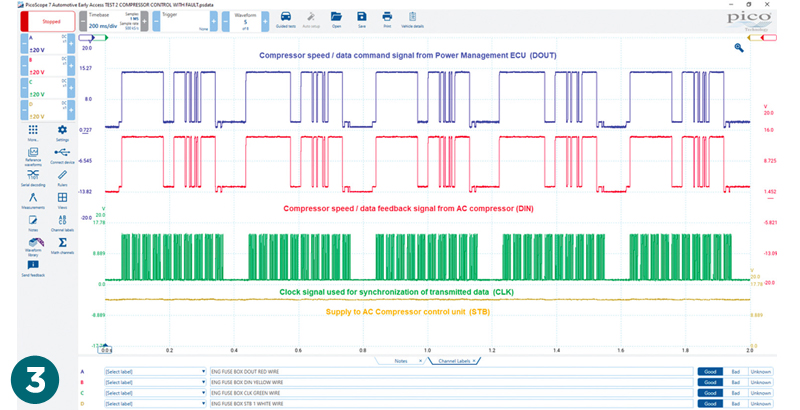
Using the PicoScope, we test all four wires simultaneously and confirm several normal operational characteristics in one single capture (Fig.3).
Referring to the image, we have immediately proved the integrity of our power supply, clock signal and communication lines, so the question is – why is there no communication?
The devil is in the detail, looking at channel A (blue) and channel B (red) above, these are command and feedback signals from the PMC and A/C compressor respectively. Note how they are identical, should they be?
When the PMC sends a command, the response from the A/C compressor would be naturally delayed. The only way in which these signals could be identical is if the communication wires were shorted together. Further testing of the wiring harness confirmed these communication lines had shorted due to recent accident damage “pinching” the loom adjacent to the A/C compressor.
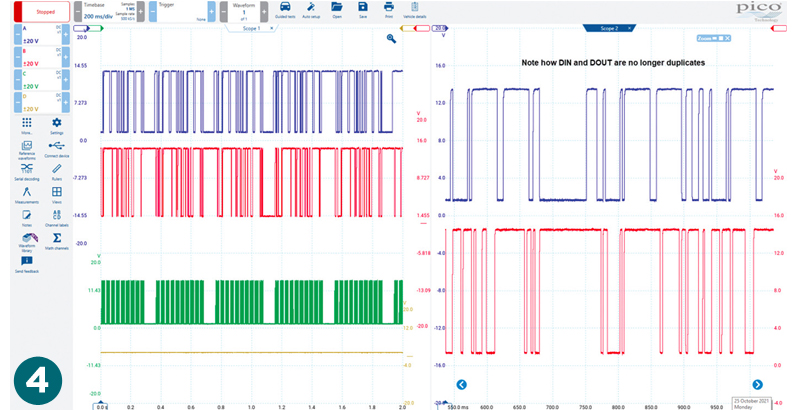
In Fig.4, we have the post-fix communication exchange between the PMC and A/C compressor. What I found interesting about this case study, was the manufacturer DTC flow chart that guides you to the faulty component. At no point are you instructed to test for continuity between the command and feedback wiring.
As you can see, we have come a long way from the 60s but plotting signals against time still rules the waves when it comes to diagnostics.