As automotive technology marches relentlessly on, the demand for equally advanced test equipment and measurement techniques has increased in direct proportion.
PicoScope automotive scopes are one such example. They sit alongside any scan tool to support the diagnostic route taken by a technician to an accurate and cost-effective conclusion. Integrating the scope throughout the diagnostic journey requires yet another new skill-set for you to grasp, but the rewards pay dividends once the skills are mastered.
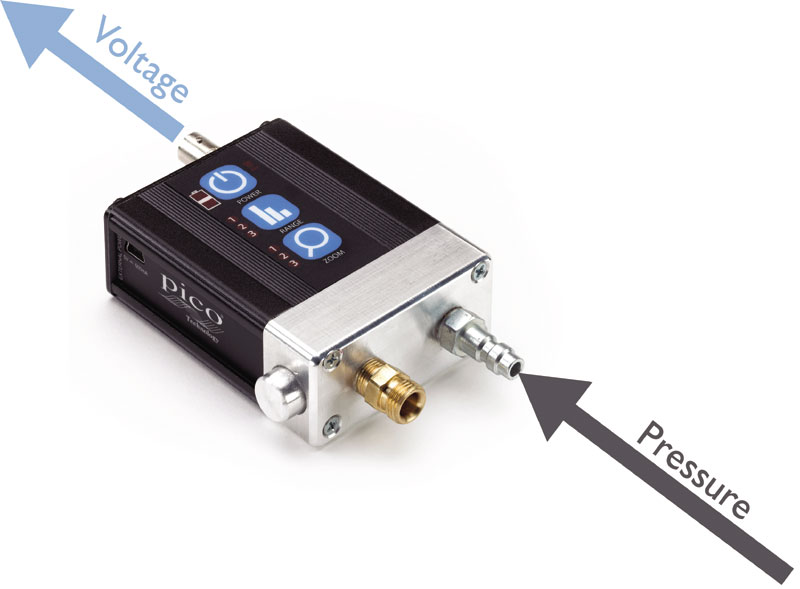
 Whilst PicoScope and the associated software remains an essential diagnostic tool, applying the relevant accessories to any PicoScope opens up another set of applications that were once reserved to gauge sets or pressure kits. The WPS500X Pressure Transducer is a great example of this. The unit simply converts pressure values to voltage which are then relayed to the PicoScope, allowing pressure to be displayed against time.
Think about the amount of pressure gauges we keep in our typical workshop environment. These can include vacuum, coolant, compression (petrol and diesel), oil pressure, boost pressure and fuel pressure gauges, to name but a few.
The WPS500X Pressure Transducer (with an array of adaptors) has the potential to not only replace these gauges, but also to far exceed their accuracy and reveal infinite detail about the transitions in pressure that were never visible with typical mechanical gauges (see image above).
Compression testing
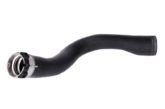
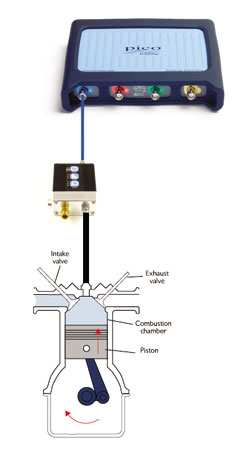
The compression test is one example where using the WPS500X – coupled to our PicoScope – will reveal far more than the maximum compression pressure. Connecting the WPS500X to a compression hose will allow for a compression measurement to be taken that is identical to our typical compression tester, but with the results displayed on our scope screen rather than reading from a mechanical gauge.
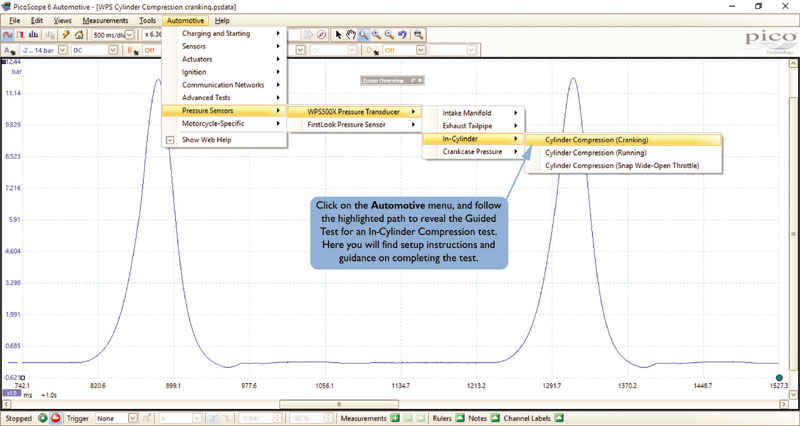
Setting up PicoScope to measure compression is straightforward using the ‘Guided Tests’ that are built into the PicoScope software.
So, whilst this all sounds very clever, what are the advantages? In order to answer this question we need to understand the waveform acquired during a typical compression test.
Test conditions:
Spark plug (glow plug) removed, injectors disconnected and wide open throttle.
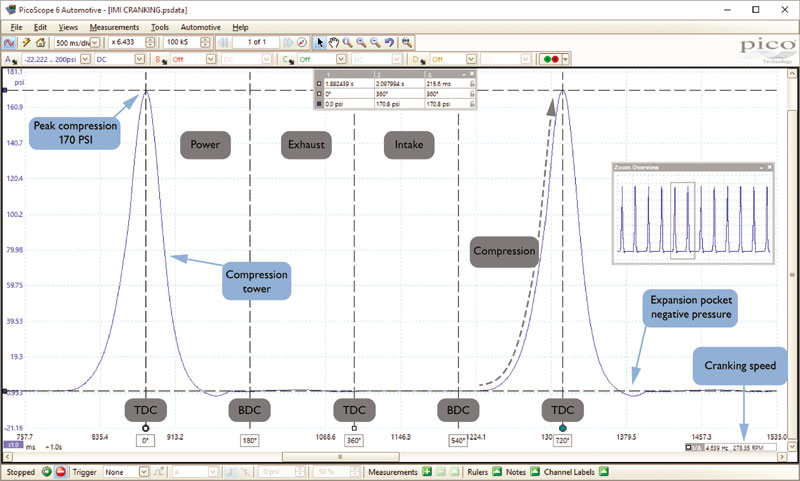
The waveform (pictured above) reveals the compression peaks at 170 psi, as would a typical compression tester. However, we can now see repeated even compression peaks (towers) as the crankshaft rotates and, more importantly, events taking place between compressions that wouldn’t be visible with a standard compression tester.
Using PicoScope we can equally divide the distance between compression events to reveal the position of the crankshaft (degrees of rotation) using our rotation markers. If we know the position of the crankshaft we can identify each of the four stroke cycles between compressions.
Look closely at the base of each compression tower, you can see the expansion pocket dropping below the zero psi rule, indicating the cylinder pressure momentarily dropped to negative (vacuum). This indicates both intake and exhaust valves remain closed with adequate sealing as the piston descends down the cylinder towards the end of the power stroke. The power stroke is referred to here as the expansion stroke as there is no combustion (the integrity of the piston compression rings and cylinder face can also be confirmed via the expansion pocket).
Using the time rulers we can also measure the time taken (frequency) for the crankshaft to rotate 360˚ and multiply this value by 60 to reveal the cranking speed (278 RPM).
What have we learned?
So let’s take a step back and look at what we have discovered from a routine compression test. As with a conventional gauge we can confirm peak pressure to be correct for the engine under test. This is where the similarities with a conventional gauge end, however:
- Using the pressure transducer we can see uniform compression towers confirming cylinder efficiency, not only as the pressure builds but also as it naturally decays during the expansion stroke. For the compression towers to be symmetrical, the mechanical integrity of the piston/cylinder and valve gear must be efficient.
- The presence of the expansion pocket confirms our cylinder can hold a vacuum and must, therefore, be air tight (valve seat and piston ring integrity OK).
- Sufficient cranking speed.
- Adequate intake and exhaust flow so achieving the correct peak pressure.
- Repeatability of peak compression for every completion of the four stroke cycle.
Now, let’s take a look at a faulty compression waveform:
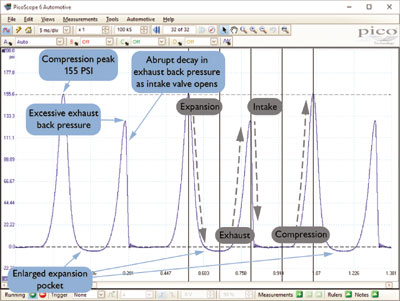
Here we can see an additional pressure peak during the exhaust event that shouldn’t be present. As the piston rises from BDC (bottom dead centre) of the expansion stroke, the exhaust valve will open to release the cylinder pressure out to the atmosphere (atmospheric pressure) via the exhaust system. The waveform indicates a pressure increase to 125 psi (approx.) during the exhaust stroke because the exhaust valve is not opening!
In effect, what we have here is another compression stroke during the 4 stroke cycle: Compression-Expansion-Compression-Intake. Our typical compression tester can’t detect this and would read a normal compression value, leading you away from the fault.
Looking a little deeper at the exhaust stroke we can see what looks to be another compression tower as a result of the exhaust valve remaining closed, only this time the tower is no longer symmetrical. But why?
The answer lays in our knowledge of the four stroke cycle; the intake stroke takes place immediately after the exhaust stroke. In this scenario we have approx. 125 psi present inside our cylinder when the intake valve opens, abruptly releasing this pressure into the intake manifold, hence the rapid drop in pressure and asymmetric tower. Such an event would manifest itself as a popping sound via the intake manifold.
Concluding thoughts
The examples in this article highlight just a small number of the major advantages when viewing pressure against time, given the accuracy and responsiveness of the transducer. The possibilities are endless when you consider the numerous automotive applications, utilising pressure fittings we already carry in our workshops today.
Part 2 of the Pico Pressure School will take a deeper look at cylinder pressure analysis, but with the engine running. We’ll also present a number of faults revealed using the pressure transducer to assist with non-intrusive diagnosis – saving us all time, money and tears!